---
title: >-
Stop Guessing Why CI Failed: Unifying E2E Tests and Backend Traces with
Pydantic Logfire
description: >-
Connect your Pytest E2E tests to backend traces with Pydantic Logfire. See
exactly why tests fail - from assertion to database query - in a single
distributed trace.
date: '2026-01-22'
authors:
- Jiri Kuncar
categories:
- Pydantic Logfire
- Testing
- CI/CD
- Python
- Observability
canonical: 'https://pydantic.dev/articles/tests-observability'
---
> Markdown version of [Stop Guessing Why CI Failed: Unifying E2E Tests and Backend Traces with Pydantic Logfire](https://pydantic.dev/articles/tests-observability) — the canonical HTML page.
>
> By [Jiri Kuncar](https://pydantic.dev/authors/jiri-kuncar.md) · 2026-01-22 · Pydantic Logfire, Testing, CI/CD, Python, Observability
>
> Related: [You perfected the wrong agent](https://pydantic.dev/articles/agents-week.md) · [Observability tools agents want](https://pydantic.dev/articles/observability-tools-agents-want.md)
>
> All articles: [/articles.md](https://pydantic.dev/articles.md) · Site index: [/llms.txt](https://pydantic.dev/llms.txt)
---
# Stop Guessing Why CI Failed: Unifying E2E Tests and Backend Traces with Pydantic Logfire
---
## The Problem: Your CI Log Says "500 Error" - Now What?
It's 4:47 PM on a Friday. Your E2E test failed in CI. The log shows:
```
FAILED test_create_order_success - AssertionError: assert 500 == 200
```
You stare at this for a moment. A 500 error. From where? The API? The database? A downstream service? The test log doesn't say. It can't say—it only knows what came back over the wire.
You now have two options:
1. SSH into your staging environment, grep through application logs, try to correlate timestamps with the test run, and hope something useful appears
2. Add `print()` statements to the backend, push a new build, wait for CI to run again, and repeat until you find it
Both approaches share the same fundamental flaw: **you're playing telephone with the truth**. The test runner saw a 500. Somewhere, an exception was thrown. Between those two facts lies a gap you're expected to bridge manually, through inference and guesswork.
This isn't a tooling problem you can solve with better log aggregation. It's an architectural problem: your test runner and backend exist in separate observability universes.
---
## Why Traditional Debugging Fails for E2E Tests
When a unit test fails, the stack trace tells you exactly what went wrong. The test and the code under test run in the same process, share the same memory, and fail together. Debugging is straightforward.
E2E tests break this model entirely. The test makes an HTTP request. The request crosses a network boundary. It hits your API, which might call a database, enqueue a background job, or invoke another service. Each of these systems has its own logs, its own error handling, its own view of what happened.
Consider what you're actually doing when you debug a failed E2E test:
1. **Find the test failure timestamp** — dig through CI logs to figure out when the test ran
2. **Correlate with backend logs** — search your log aggregator for entries around that timestamp
3. **Filter by request path** — hope your logs include enough context to identify the specific request
4. **Trace through services** — if the request touched multiple services, repeat steps 2-3 for each one
5. **Reconstruct the timeline** — mentally piece together what happened across systems
This process takes anywhere from 10 minutes to several hours, depending on how many services are involved and how well your logs are structured. And you do this for every failed test. Every time.
The frustrating part? All the information you need exists. Your backend already knows what happened. It logged the exception. It recorded the database query. It tracked the background job. The problem isn't missing data—it's that the data isn't connected to the test that triggered it.
**What if clicking the failed test showed you the exact database query that timed out? What if you could see the entire request lifecycle, from test assertion to background worker, in a single timeline? And what if an AI could analyze that timeline and suggest a fix?**
---
## The Insight: Your Test Runner is Just Another Service
Here's the mental shift that changes everything: **treat your test runner as a microservice**.
Your API emits traces. Your workers emit traces. Your database calls are instrumented. Why should your test runner be any different? It's making HTTP requests. It's waiting for responses. It has expectations about what should happen. These are all observable behaviors.
When you instrument your test runner the same way you instrument your backend, something powerful happens: the traces connect. A single distributed trace flows from the test assertion, through the HTTP client, into your API, through your business logic, into your worker, and back. Every span is linked. Every timing is captured. Every exception is recorded in context.
```
[Test: test_create_order]
└── [HTTP POST /orders]
└── [API: validate_order]
└── [API: enqueue_job]
└── [Worker: process_order]
└── [Worker: check_inventory]
└── [Worker: reserve_stock]
```
Now when a test fails, you don't grep logs. You click the failed span and see exactly what happened, where it happened, and why.
---
## Setup
### 1. Install Dependencies
```bash
uv add "logfire[fastapi,httpx,redis]" fastapi uvicorn httpx arq redis pydantic
uv add opentelemetry-instrumentation-arq # For ARQ worker tracing
uv add --group test pytest pytest-asyncio
uv run logfire auth # One-time login
```
### 2. Instrument Your API
```python
# src/api.py
import os
from typing import Annotated
import logfire
from arq.connections import ArqRedis, create_pool, RedisSettings
from fastapi import FastAPI, HTTPException
from pydantic import BaseModel, Field
from opentelemetry.instrumentation.arq import ArqInstrumentor
logfire.configure(service_name="order-api")
ArqInstrumentor().instrument() # Trace ARQ job enqueuing
app = FastAPI(title="Order API")
logfire.instrument_fastapi(app)
# Redis connection pool (initialized on startup)
redis_pool: ArqRedis = None
@app.on_event("startup")
async def startup():
global redis_pool
redis_pool = await create_pool(
RedisSettings(host=os.getenv("REDIS_HOST", "localhost"))
)
class OrderRequest(BaseModel):
product_id: str
quantity: Annotated[int, Field(gt=0)]
class OrderResponse(BaseModel):
order_id: str
status: str
@app.post("/orders", response_model=OrderResponse)
async def create_order(order: OrderRequest) -> OrderResponse:
order_id = f"ORD-{order.product_id}-{order.quantity}"
with logfire.span("enqueue_order_processing"):
await redis_pool.enqueue_job(
"process_order", order_id, order.product_id, order.quantity
)
logfire.info("Order queued", order_id=order_id)
return OrderResponse(order_id=order_id, status="processing")
```
### 3. Instrument Your Worker
```python
# src/worker.py
import asyncio
import os
import logfire
from arq.connections import RedisSettings
from opentelemetry.instrumentation.arq import ArqInstrumentor
logfire.configure(
service_name="order-worker",
send_to_logfire="if-token-present",
distributed_tracing=True, # Enable distributed tracing
)
ArqInstrumentor().instrument()
async def process_order(ctx: dict, order_id: str, product_id: str, quantity: int) -> dict:
"""Process an order - simulates inventory check and fulfillment."""
with logfire.span("process_order", order_id=order_id):
with logfire.span("check_inventory", product_id=product_id):
await asyncio.sleep(0.1) # Simulate DB lookup
logfire.info("Inventory checked", available=True)
with logfire.span("reserve_stock", quantity=quantity):
if quantity > 100:
logfire.error("Insufficient stock", requested=quantity, available=100)
raise ValueError(f"Cannot fulfill {quantity} units")
logfire.info("Stock reserved", quantity=quantity)
with logfire.span("notify_fulfillment"):
logfire.info("Fulfillment notified", order_id=order_id)
return {"order_id": order_id, "status": "completed"}
class WorkerSettings:
functions = [process_order]
redis_settings = RedisSettings(host=os.getenv("REDIS_HOST", "localhost"))
```
The `send_to_logfire="if-token-present"` config in the worker means:
- In CI with token: traces go to Logfire with full CI context
- Locally without token: graceful fallback to console
- Fork PRs without secrets: tests still pass
### 4. The Magic: `conftest.py`
> **Note:** With the latest version of Logfire, you no longer need the conftest modifications shown below. Simply run `pytest --logfire` to enable automatic test tracing. The conftest.py pattern is kept here for reference and for users who need custom trace context propagation. See the [Logfire pytest integration docs](https://pydantic.dev/docs/logfire/integrations/pytest/#migration-from-conftestpy-pattern) for migration details.
This is where we connect Pytest to the trace:
```python
# tests/conftest.py
import os
from typing import Any, Generator
import httpx
import logfire
import pytest
from opentelemetry import trace
from opentelemetry.trace import StatusCode
API_BASE_URL = os.getenv("API_BASE_URL", "http://localhost:4080")
logfire.configure(
service_name="e2e-tests",
send_to_logfire=True,
inspect_arguments=False, # Avoid introspection warnings in pytest
)
logfire.instrument_httpx(capture_request_body=True, capture_response_body=True)
# Stash key for storing the current span
_span_key = pytest.StashKey["trace.Span"]()
@pytest.hookimpl(hookwrapper=True)
def pytest_runtest_protocol(item: pytest.Item):
"""Wrap each test in a Logfire span for distributed tracing."""
location = item.location
with logfire.span("test: {test_name}", test_name=item.name) as span:
span.set_attributes({
"test.filepath": location[0],
"test.lineno": location[1],
"test.function": location[2],
})
item.stash[_span_key] = trace.get_current_span()
yield
@pytest.hookimpl(hookwrapper=True)
def pytest_runtest_makereport(
item: pytest.Item, call: pytest.CallInfo[Any]
) -> Generator[None, Any, None]:
"""Capture test outcome in span attributes and mark as error if failed."""
outcome = yield
report = outcome.get_result()
if report.when == "call" and (span := item.stash.get(_span_key, None)):
span.set_attribute("test.outcome", report.outcome)
if report.failed and call.excinfo:
span.set_status(
StatusCode.ERROR,
f"{call.excinfo.typename}: {call.excinfo.value}",
)
span.record_exception(call.excinfo.value)
def pytest_sessionfinish(session: pytest.Session, exitstatus: int):
"""Critical: Flush traces before CI runner dies."""
logfire.force_flush(timeout_millis=5000)
@pytest.fixture
@logfire.instrument("traced_client", allow_generator=True)
def traced_client():
"""HTTP client with trace context propagation."""
def _inject_context(request: httpx.Request) -> None:
request.headers.update(logfire.get_context()) # The magic!
with httpx.Client(
base_url=API_BASE_URL,
timeout=10.0,
event_hooks={"request": [_inject_context]},
) as client:
yield client
```
The key line is `logfire.get_context()` — it returns W3C `traceparent` headers that link your test's trace to the backend.
---
## The Test: Simple, But Now Observable
```python
# tests/test_e2e.py
import logfire
def test_create_order_success(traced_client):
"""Test successful order creation - trace spans API -> Worker."""
with logfire.span("create_order_flow"):
response = traced_client.post(
"/orders",
json={"product_id": "WIDGET-42", "quantity": 5},
)
assert response.status_code == 200
data = response.json()
assert data["status"] == "processing"
assert "ORD-" in data["order_id"]
def test_create_order_invalid_quantity(traced_client):
"""Test validation error - trace shows where it failed."""
response = traced_client.post(
"/orders",
json={"product_id": "WIDGET-42", "quantity": -1},
)
assert response.status_code == 422
assert "greater than 0" in response.json()["detail"][0]["msg"].lower()
```
Nothing special here. The magic is in `conftest.py` - every HTTP call automatically carries the trace context. The `pytest_runtest_makereport` hook captures test failures and records them as span errors with full exception details.
---
## What You See in Pydantic Logfire
When this test runs, Logfire shows a single trace that spans all three services:
The W3C `traceparent` header flows through every HTTP request and job queue message, stitching the test runner, API, and worker together automatically.
**When it fails**, you click the red span and see:
- The exact exception with full stack trace—not "500 Internal Server Error," but `ValueError: Cannot fulfill 150 units` with the line number where it was raised
- Which service threw it—was it the API during validation, or the worker during fulfillment?
- What the request/response payloads were—the actual JSON your test sent and what came back (captured by `instrument_httpx`)
- How long each step took before failure—did the database query take 3 seconds before timing out?
- Test outcome attribute (`test.outcome: "failed"`)—the span itself is marked as an error
No grepping. No timestamp correlation. No guessing. You click, you see, you understand.
---
## Why This Beats Traditional Logging
| Aspect | Traditional Logs | Logfire Tracing |
|--------|-----------------|-----------------|
| **Correlation** | Manual timestamp matching | Automatic trace ID linking |
| **Context** | Scattered across services | Single unified timeline |
| **Payload visibility** | JSON strings (often truncated) | Structured, expandable Pydantic models |
| **Failure location** | "Somewhere in the backend" | Exact span with stack trace |
| **CI Integration** | Separate dashboards | Same traces as production |
The Pydantic integration deserves special mention. When your API uses Pydantic models (and if you're using FastAPI, it does), Logfire understands the structure of your data. Instead of seeing `{"product_id": "WIDGET-42", "quantity": 5}` as an opaque JSON string, you see it as an expandable `OrderRequest` object with typed fields. This makes debugging data validation errors dramatically easier—you can see exactly which field failed validation and why.
There's also a subtler benefit: **your test traces and production traces use the same infrastructure**. The same dashboard. The same query language. The same alerting rules. When you find a bug in your E2E tests, you can search for the same pattern in production to see if it's already affecting users. When you fix a production issue, you can verify the fix in your test suite and see both traces side by side.
---
## Beyond Debugging: Automatic Issue Tracking and AI-Assisted Fixes
Logfire's [Issues feature](https://pydantic.dev/docs/logfire/observe/issues/) automatically groups exceptions and surfaces them as trackable issues.
### How Issues Work
Instead of seeing 47 separate `"ValueError in reserve_stock"` log entries, you see a single issue with a hit count of 47. Logfire groups exceptions by their fingerprint—a combination of exception type, message pattern, and stack trace location. This transforms noise into signal.
1. **Automatic Detection**: Every exception in your traces becomes a potential issue. No manual tagging required.
2. **Smart Grouping**: Similar exceptions collapse into single issues. You see "ValueError in reserve_stock" once, with metadata showing frequency, first seen, last seen, and affected services.
3. **State Management**: Issues can be Open, Resolved, or Ignored. Resolved issues auto-reopen if the exception recurs—so you know immediately if a "fixed" bug comes back.
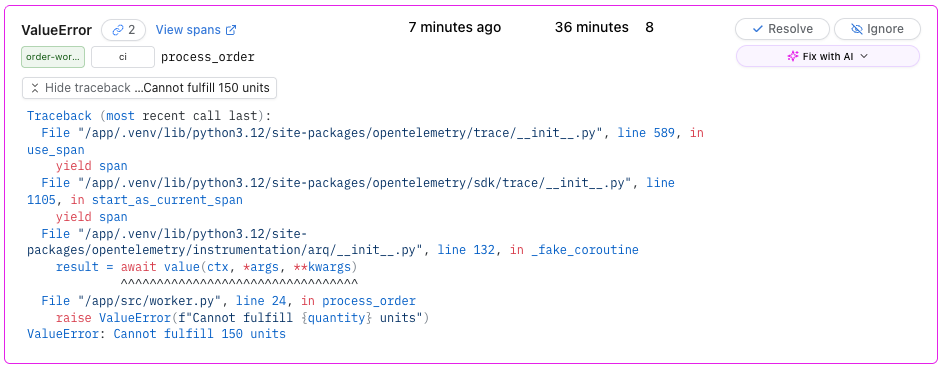
This changes how you think about test failures. Instead of treating each failed CI run as an isolated event, you start seeing patterns. "This test has failed 12 times this week, always with the same database timeout." That's not a flaky test—that's a systemic issue worth investigating.
### Fix with AI
When you paste a stack trace into an AI assistant, you're giving it incomplete information—the exception without the request, database query, or timing that might reveal a race condition.
[Logfire's MCP](https://pydantic.dev/docs/logfire/guides/mcp-server/) (Model Context Protocol) server gives AI assistants direct access to your traces. When you see a failing test:
1. Click on the issue to see the full exception details and trace
2. Use the **"Fix with AI"** feature to pass the complete context to Claude Code or other AI assistants
3. The AI receives everything: the exception, the stack trace, the request payload, the response, the timing of each span, and the relationships between services
4. Get debugging suggestions grounded in actual runtime behavior, not just static code analysis
```bash
# Example: Using Claude Code with Logfire MCP
claude "$(uvx logfire@latest --region us prompt --project jirikuncar/testing-with-logfire fix-span-issue:019bdd2940d8e36b652dd1041158a7ab --claude)"
```
> **Learn more:** For a comprehensive guide on using the Logfire MCP server with AI assistants, see our [Logfire MCP blog post](https://pydantic.dev/articles/logfire-mcp-is-awesome).
The difference is profound. Instead of the AI guessing "maybe there's a null check missing," it can say "the `check_inventory` span took 3.2 seconds, which exceeded the 3-second timeout configured in `reserve_stock`. The inventory service is slow under load—consider increasing the timeout or adding a circuit breaker."
This closes the loop: **test fails → trace captured → issue created → AI analyzes with full context → targeted fix suggested** — all without leaving your workflow.
---
## CI Configuration (GitHub Actions)
You can start with the following example configuration workflow that includes enhanced tracing metadata for:
- **Environment tagging**: `LOGFIRE_ENVIRONMENT: "ci"` tags all traces from CI, making them easy to filter
- **CI metadata**: `OTEL_RESOURCE_ATTRIBUTES` adds:
- `ci.job.id`: Links traces to specific GitHub Actions run
- `ci.job.url`: Direct link back to the CI run that generated the trace
When you click a trace in Logfire from CI, you'll see the `ci.job.url` attribute with a link back to the exact GitHub Actions run that created it.
```yaml
jobs:
test:
runs-on: ubuntu-latest
services:
redis:
image: redis:7-alpine
# ... health check configuration
env:
LOGFIRE_ENVIRONMENT: "ci"
OTEL_RESOURCE_ATTRIBUTES: "ci.job.id=${{ github.run_id }},ci.job.url=${{ github.server_url }}/${{ github.repository }}/actions/runs/${{ github.run_id }}"
steps:
- uses: actions/checkout@v4
- name: Install uv
uses: astral-sh/setup-uv@v4
with:
version: "latest"
- name: Set up Python
run: uv python install
- name: Install dependencies
run: uv sync --all-extras
- name: Start API server
run: |
uv run uvicorn src.api:app --host 0.0.0.0 --port 4080 &
sleep 3
env:
LOGFIRE_TOKEN: ${{ secrets.LOGFIRE_TOKEN }}
LOGFIRE_DISTRIBUTED_TRACING: "true"
- name: Start Worker
run: |
uv run arq src.worker.WorkerSettings &
sleep 2
env:
LOGFIRE_TOKEN: ${{ secrets.LOGFIRE_TOKEN }}
- name: Run E2E tests
run: uv run pytest tests/ -v --tb=short
env:
LOGFIRE_TOKEN: ${{ secrets.LOGFIRE_TOKEN }}
API_BASE_URL: http://localhost:4080
```
---
## Key Takeaways
1. **`logfire.get_context()` is the bridge** — This function returns W3C `traceparent` headers that link your test's trace to everything downstream. No manual correlation required.
2. **`force_flush()` is non-negotiable** — CI runners terminate immediately after tests complete. If you don't flush traces before the process dies, you lose them.
3. **Capture test outcomes on spans** — The `pytest_runtest_makereport` hook records pass/fail status directly on spans, making failures searchable and alertable.
4. **Issues turn noise into signal** — Logfire groups exceptions by fingerprint, revealing patterns like "This exception has occurred 23 times across 4 services."
5. **AI with context beats AI without it** — Traces give AI assistants timing, payloads, and service relationships—turning generic suggestions into specific fixes.
The gap between "test failed" and "here's why" was always a tooling problem. Logfire closes it with minimal configuration—the same observability patterns you use in production work identically for your test suite.
---
## Resources
- [Logfire documentation](https://pydantic.dev/docs/logfire/get-started)
- [Logfire Issues](https://pydantic.dev/docs/logfire/observe/issues/)
- [Logfire MCP Server](https://pydantic.dev/docs/logfire/integrations/llms/mcp/) — for AI-assisted debugging
- [OpenTelemetry Python](https://opentelemetry.io/docs/languages/python/)
- [W3C Trace Context spec](https://www.w3.org/TR/trace-context/)