Every service has an implicit reliability target. The team has a rough idea of how often it can fail before users notice, when to roll back a deployment, when to page on-call. The problem is that the target is implicit: different people hold different numbers in their heads, and "is this bad enough to page?" gets re-litigated in every incident.
A Service Level Objective (SLO) makes that target explicit. It is a written promise about how reliable a service has to be, measured against an indicator the team agreed on in advance. "99.9% of requests over the last 30 days returned a non-5xx response" is an SLO. So is "95% of search queries finish under 300ms." What matters is that the team committed to a specific number instead of each engineer carrying their own guess.
Writing one down also gives you a budget instead of an absolute. At 99.9% over 30 days, a service is allowed to be unavailable for roughly 43 minutes before the SLO is missed. That budget is something concrete to spend: ship the risky migration, run the chaos experiment, deploy on a Friday. When it runs out, freeze releases and fix whatever is consuming it. Alerts are how the on-call rotation finds out the budget is in trouble before it is gone.
This guide walks through that whole loop. It starts with the basics of SLIs and error budgets, explains why naive threshold alerts produce too much noise (or too much silence), and introduces the multi-window, multi-burn-rate pattern from the Google SRE workbook. Then it covers two ways to run this in Pydantic Logfire: service levels, which build the objective and its burn-rate alerts for you, and the underlying SQL, for the cases where you need an indicator the built-in flow doesn't cover. The post finishes with a way to backtest an alert against a known past incident before it goes live.
TL; DR
- SLI: the thing you measure. For HTTP services, usually the fraction of requests that did not return 5xx.
- SLO: the target for that measurement, e.g. 99.9% non-5xx responses over 30 days.
- Error budget: what the SLO allows you to spend. At 99.9% over 30 days, that is 43 minutes of full downtime.
- Burn rate: how fast you are spending the budget, expressed as a multiple of the sustainable rate.
- Multi-window, multi-burn-rate: fire a page when a fast window AND a slow window both show a high burn rate. Detect outages quickly, ignore short blips.
- In Logfire: create a reliability target, pick a type and a goal, and Logfire generates the burn-rate alerts. Targets cover availability, latency, LLM call failures, eval scores, or your own SQL, and are an Enterprise feature with a limited number on Growth. Everywhere else you build it yourself: burn rate is a single arithmetic expression, and the same expression powers both the dashboard and the alerts.
What an SLO actually measures
An SLO is built from three things, in order:
- Service Level Indicator (SLI): a ratio of good events to total events. For an HTTP API, the most common indicator is
non-5xx responses / total responses. For a queue, it might bemessages delivered within deadline / total messages. For a database,successful queries / total queries. - Service Level Objective (SLO): a target for that ratio over a rolling window. "99.9% of requests over the last 30 days returned a non-5xx response."
- Error budget: the allowed shortfall. If the SLO is 99.9%, the budget is 0.1% of requests. Over 30 days, that translates to roughly 43 minutes if the service is consistently down, or many more minutes if the failures are spread out.
The error budget is the part teams underuse. It exists to make reliability a tradeoff, which means using it: when there is room, that's the time to ship the migration you have been putting off, and when it is exhausted, freeze releases until the service recovers.
The SLI we use throughout this post is HTTP availability:
availability = count(http_response_status_code < 500) / count(*)
Everything that follows generalizes to any ratio SLI. Latency SLOs work the same way once you pick a threshold (for example, "good = response under 300ms") and count the responses below it.
Picking a good SLI
The mechanics that follow are only as useful as the indicator they are wrapped around. A bad SLI produces noise no matter how careful the alerting is, so it pays to settle this before building anything on top.
A few rules that tend to hold:
- Measure what the user sees. A queue that drains successfully but takes 10 minutes is not "available" from the user's perspective. Latency belongs in the SLI, not in a separate dashboard nobody opens. When you do mix in latency, scope the SLI to incoming requests rather than every span in your trace data, so internal work does not inflate the denominator.
- Exclude what you cannot control. 4xx responses are usually client error and should not count against availability. Same for traffic from synthetic monitoring, if it is significant.
- Pick a target you can actually defend. 99.99% sounds impressive and is almost never the right answer. The error budget at 99.99% over 30 days is 4 minutes. One bad deploy and the budget is gone.
- One SLO per critical user journey. "Login works", "search returns results", "checkout completes". Aggregate availability across an entire product is hard to act on.
No single SLO covers an entire system. Set one up per service that has its own on-call rotation, and tune the goal per service based on what users actually need.
Why a single threshold alert is not enough
The first alert most teams write looks something like this:
If the 5xx rate is above 0.1% for 5 minutes, page someone.
This works for the dramatic case where the service is hard down. It fails in two more common cases.
False positives. A brief blip, ten failed requests in a quiet minute, can easily cross 0.1% and page someone at 3am. The error rate genuinely spiked, but the underlying problem was already gone by the time the page arrived.
False negatives. A slow, sustained leak, 0.05% of requests failing for two weeks, never triggers the threshold. It silently consumes the entire monthly error budget. By the time anyone notices, there is no budget left to absorb the next real incident.
The deeper problem is that the threshold has no concept of the budget. It treats every minute the same, regardless of whether you have spent 5% or 95% of the budget for the month. SLO alerting fixes this by alerting on the rate at which the budget is being consumed.
Burn rate, explained
The burn rate is the multiple of the sustainable error rate that you are currently experiencing.
burn_rate = observed_error_rate / (1 - SLO_goal)
For an SLO of 99.9%, the sustainable error rate is 0.1%. If the current error rate is 1.44%, the burn rate is 14.4x. At that rate, you would consume an entire 30-day error budget in roughly two days.
The same relationship rearranges into a threshold on the error rate, which is handy when configuring alerts against a metrics system that reports rates rather than ratios:
error_rate_threshold = burn_rate × (1 - SLO_goal)
For a 14.4x burn rate against a 99.9% SLO, the equivalent error rate is 14.4 × 0.001 = 1.44%. Both forms describe the same condition; pick whichever your query language makes easier to read.
Two reference points worth memorizing:
- 14.4x burn rate sustained for 1 hour consumes 2% of a 30-day budget.
- 6x burn rate sustained for 6 hours consumes 5% of a 30-day budget.
These are the two thresholds from the Google SRE workbook, and we will use them as reference lines on the dashboard.
A burn rate of 1 means you are spending the budget exactly at the rate the SLO allows. Anything above 1 means the budget is shrinking faster than the rolling window can replenish it. Anything below 1 means it is recovering.
Multi-window, multi-burn-rate alerts
A burn rate alert with a single window has a tradeoff between detection time and noise:
- Short window (5 minutes): detects incidents fast, but a single bad minute can trip the alert.
- Long window (1 hour): only fires on sustained problems, but pages arrive 30 to 45 minutes after the incident starts.
The multi-window, multi-burn-rate (MWMBR) pattern resolves this by requiring both a long window and a short window to be over the threshold at the same time. The long window provides confidence (the issue is real and sustained), and the short window provides recency (the issue is still happening right now, not an hour ago that has since recovered).
The standard configuration from the SRE workbook uses three alert tiers:
| Severity | Long window | Short window | Burn rate threshold | Budget consumed before firing |
|---|---|---|---|---|
| Page | 1 hour | 5 minutes | 14.4 | 2% in 1 hour |
| Page | 6 hours | 30 minutes | 6 | 5% in 6 hours |
| Ticket | 3 days | 6 hours | 1 | 10% in 3 days |
The first two tiers catch acute incidents. The third catches the slow leak that would otherwise drain the budget unnoticed.
Set a reliability target in Logfire
This section describes the Service Levels feature, which introduces reliability targets. It is available to customers on the Enterprise plan, with a limited number on the Growth plan, and no limit when self-hosted. If your plan doesn't include it, skip to Building a custom SLO dashboard and run the SLO from SQL. Open Service levels in the sidebar (in the Notify section), or click on the Set target button on any row of the Services inventory.
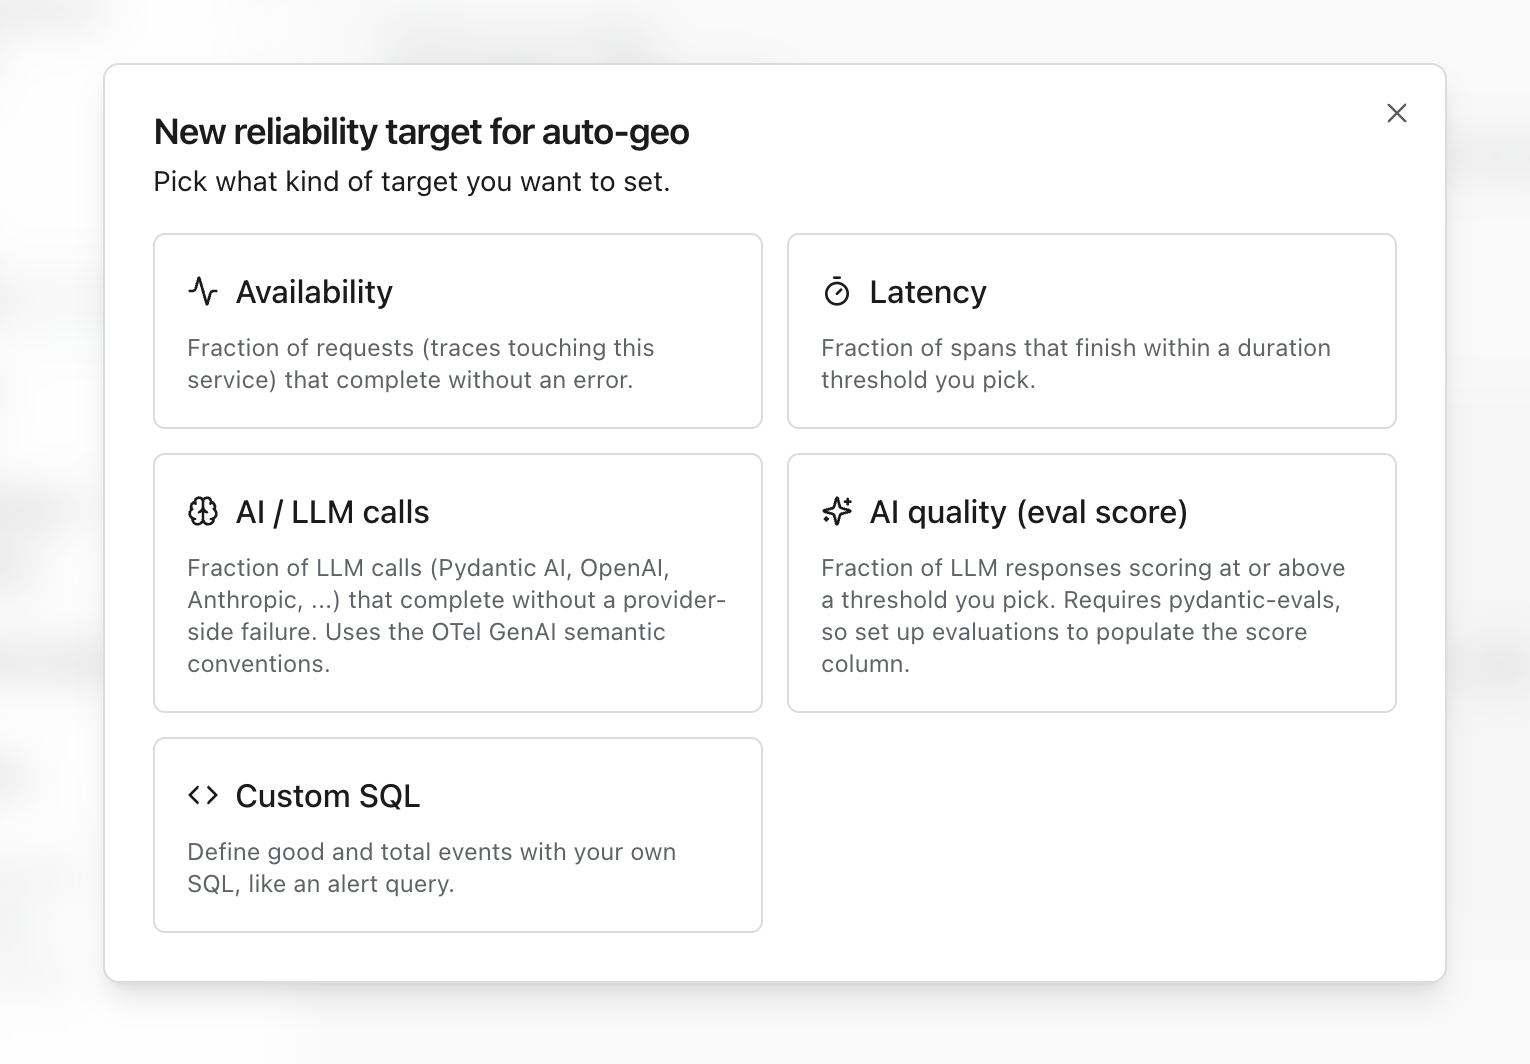
The first choice is what "reliable" means for the thing you are measuring. You can pick from:
- Availability, the fraction of requests that complete without an error. The SLI used throughout this post.
- Latency, the fraction of spans finishing inside a duration you choose.
- AI / LLM calls, the fraction of model calls that complete without a provider-side failure, read from the OpenTelemetry GenAI conventions rather than from any particular framework.
- AI quality, the fraction of responses scoring at or above a threshold, using scores from Pydantic Evals.
- Custom SQL, your own definition of good and total events.
You set the goal, the window, and what counts as a good event, and Logfire fills in sensible defaults for whichever type you pick. Saving generates up to three burn-rate alerts, fast, medium, and slow; tiers that cannot structurally fire for a low target are skipped. Pick notification channels for the generated tiers during creation, or route each alert from the target's detail page afterwards, so the fast one pages and the slow one opens a ticket.
Targets are editable after the fact. Change the goal, the rolling window, or the predicate that defines a failure, and saving regenerates the linked burn-rate alerts in place — routing, run history, and mute preferences intact.
As you tune the goal, a live preview backtests the target against your recent data and shows the success rate and burn before you commit to it.
The five target types cover most of what teams set up, and Custom SQL is the middle ground: your own good and total events, with Logfire still generating the burn-rate alerts.
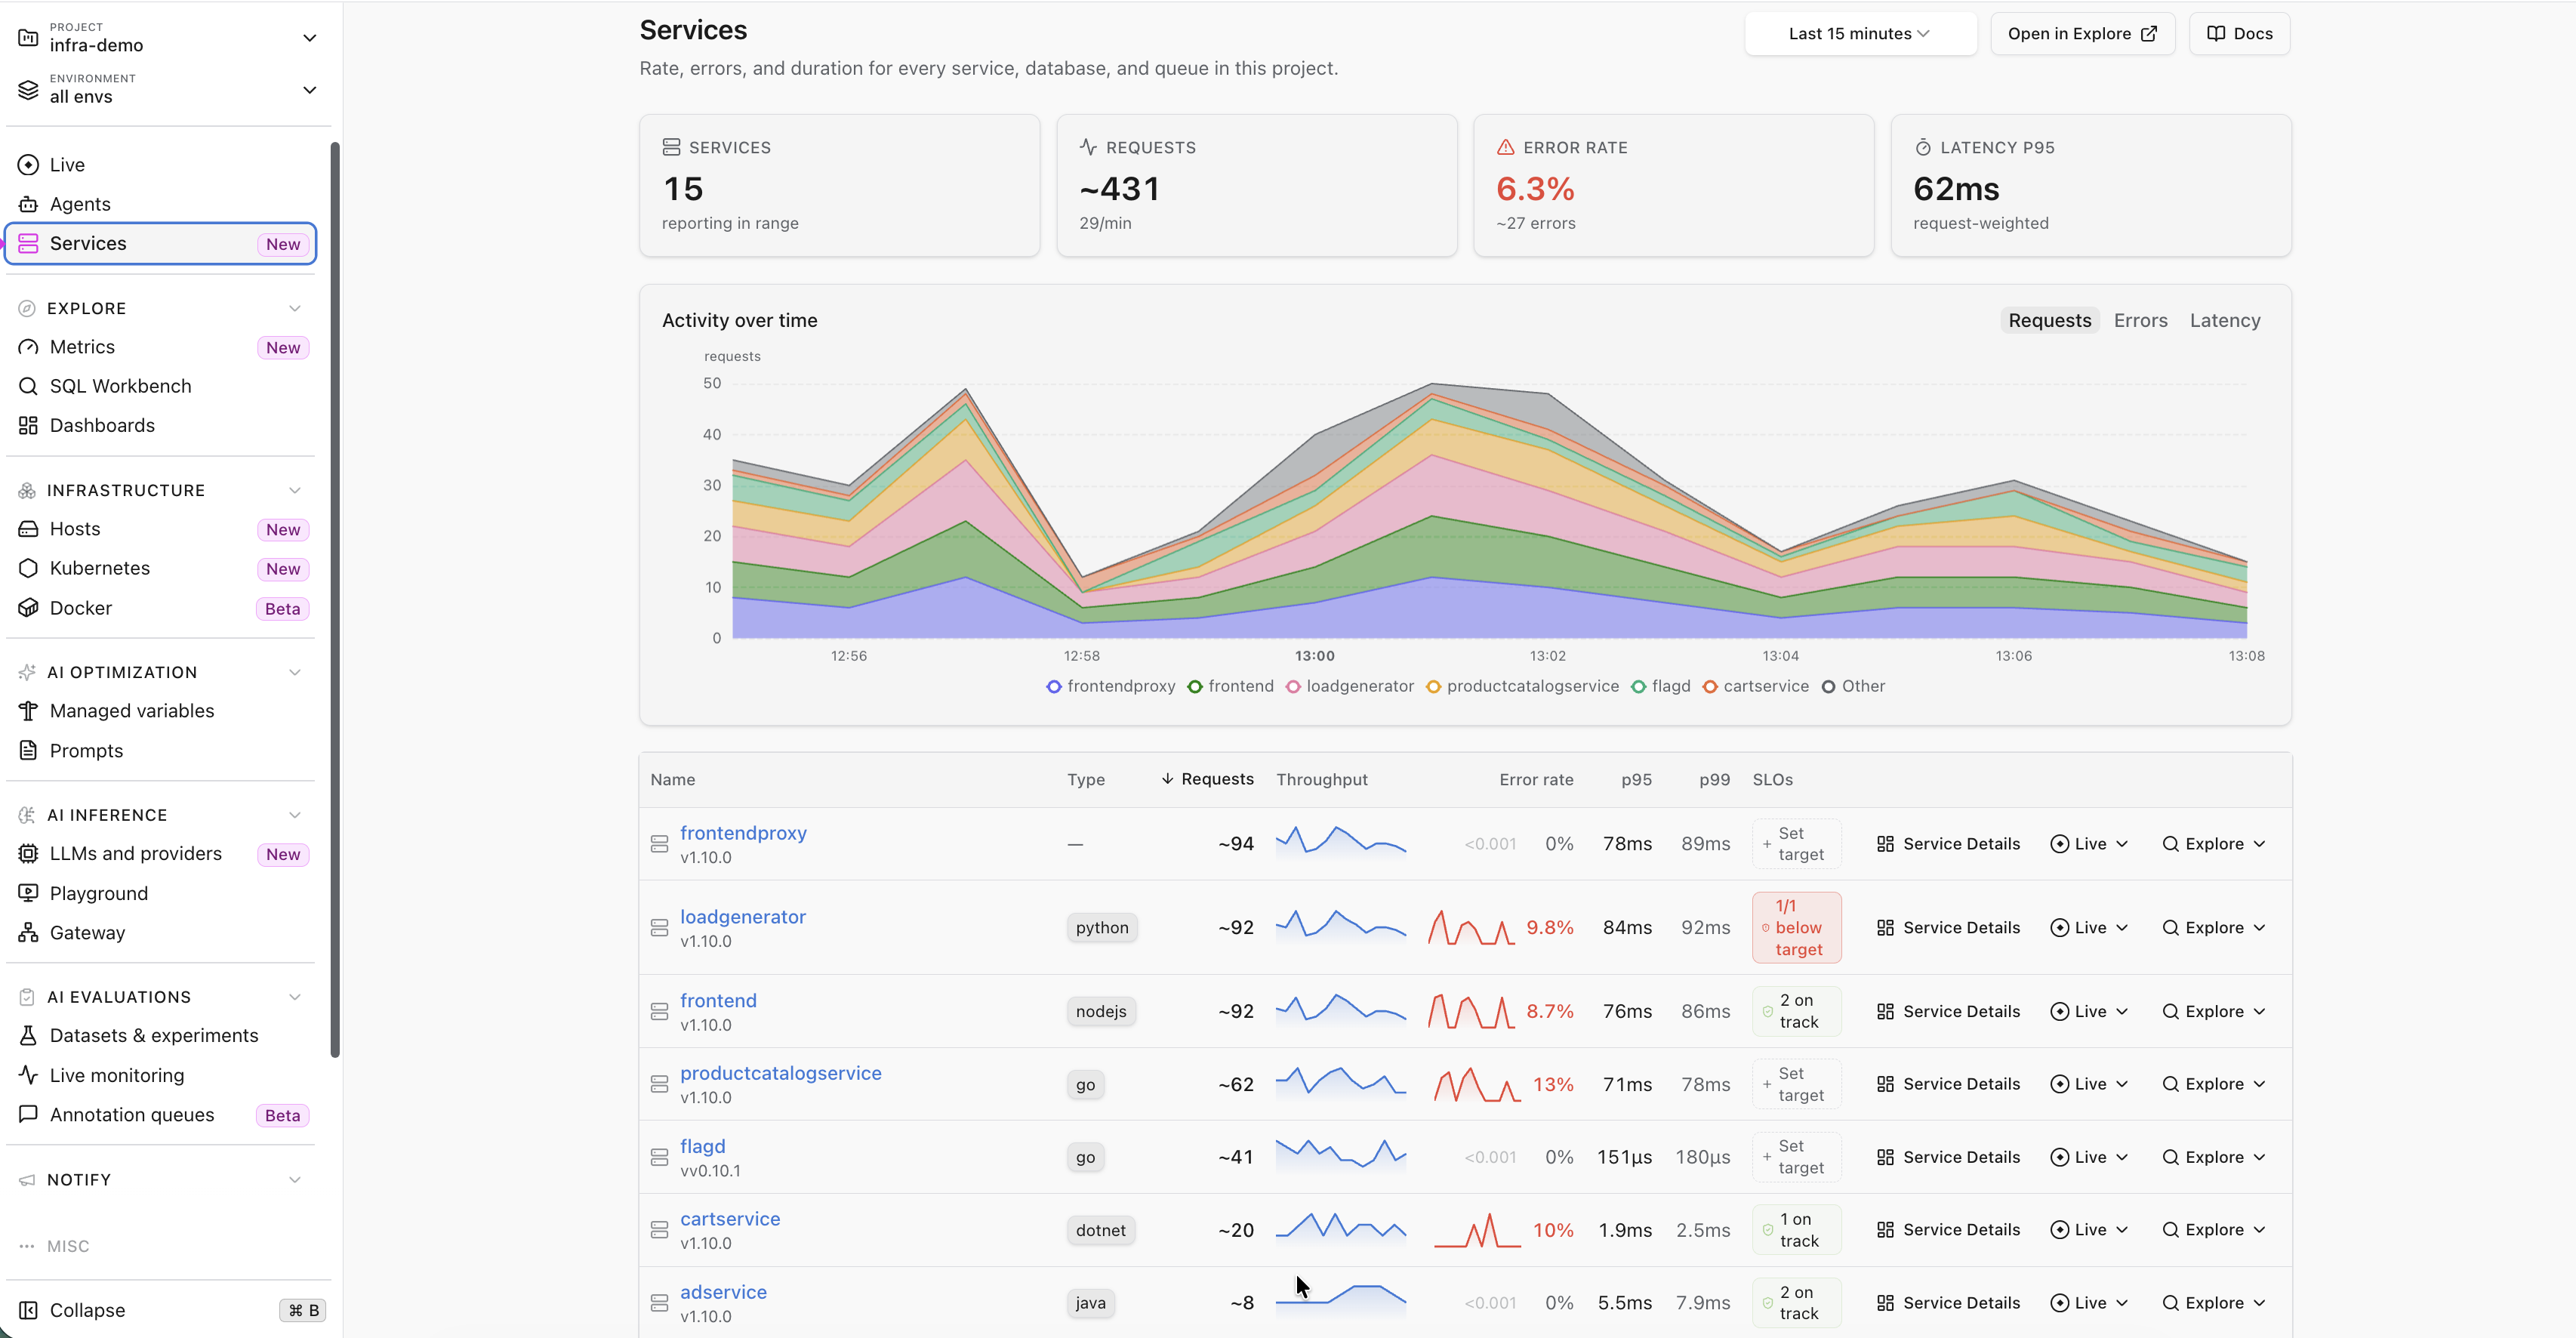
Once a target is saved, the SLOs column on the Services inventory carries its state, so the whole project reads at a glance: 2 on track for a service meeting both of its targets, 1/1 below target for one that is missing its only target, and a Set target button on the services that have none yet.
SLOs on the model layer
AI / LLM calls and AI quality point at the model rather than your code, and neither has an equivalent in the SQL below. AI / LLM calls treats provider failures as the bad events, so when a provider degrades and your retries stop absorbing it, the burn rate moves. AI quality asks something else entirely: not whether the call succeeded, but whether the answer was good enough, held to a number over a rolling window. Availability SLOs have been standard practice for a decade. A reliability target on output quality is the thing agent teams have not had.
Providers get a shortcut too. On the AI Inference section, LLMs and providers carries a Reliability column where the whole target is one sentence you fill in: alert me when fewer than 99% of calls to Anthropic finish without a server error, measured over 28 days. Swap the condition to "respond within" and you get a latency target instead, which catches the slow degradation that never shows up as an error. One target covers the provider across every service that calls it.
Building a custom SLO dashboard
This section describes how to build custom SLO dashboards if your plan doesn't have access to the reliability target feature.
A Logfire dashboard is a collection of panels, each backed by a SQL query against the records table (the table of spans captured from your services). For an SLO dashboard, you will need at least the three following variables:
service_name: the set of services to include.slo_goal: the SLO target as a decimal, default0.999.resolution: the time bucket for the time-series panels, default5 minutes.
The queries below are written against those variables and the records table. Add them to the Custom Dashboards panels on your Logfire project.
Current availability
A single number for the selected services and time range:
SELECT
  ROUND(
    100.0 * COUNT(*) FILTER (WHERE http_response_status_code < 500)
         / NULLIF(COUNT(*), 0),
    4
  ) AS "Availability %"
FROM records
WHERE array_has($service_name, service_name)
  AND http_response_status_code IS NOT NULL
http_response_status_code < 500 is the "good event" definition. Everything else is the SLI denominator.
Error budget remaining
The fraction of the budget not yet consumed in the current window. 100% means no errors. 0% means the budget for the window is gone.
SELECT
  ROUND(
    GREATEST(
      0,
      100.0 * (
        1.0 - (COUNT(*) FILTER (WHERE http_response_status_code >= 500)::double
               / NULLIF(COUNT(*), 0))
              / (1.0 - CAST($slo_goal AS DOUBLE))
      )
    ),
    2
  ) AS "Budget Remaining %"
FROM records
WHERE array_has($service_name, service_name)
  AND http_response_status_code IS NOT NULL
This is the most important number on the dashboard. If it trends toward zero, the SLO is at risk regardless of what any individual alert says.
Burn rate over time
The line chart that drives the alerting strategy. The two horizontal reference lines are the fast and slow burn thresholds.
SELECT
  time_bucket($resolution, start_timestamp) AS x,
  ROUND(
    (COUNT(*) FILTER (WHERE http_response_status_code >= 500)::double
     / NULLIF(COUNT(*), 0))
    / (1.0 - CAST($slo_goal AS DOUBLE)),
    2
  ) AS burn_rate,
  14.4 AS fast_burn_threshold,
  6.0  AS slow_burn_threshold
FROM records
WHERE array_has($service_name, service_name)
  AND http_response_status_code IS NOT NULL
GROUP BY x
ORDER BY x
When the burn_rate line crosses the dashed thresholds, the alerts described in the next section should fire.
All services summary
A table that ranks services by burn rate, useful when triaging which service is responsible for the budget drain:
SELECT
  service_name,
  COUNT(*) AS total_requests,
  COUNT(*) FILTER (WHERE http_response_status_code >= 500) AS errors_5xx,
  ROUND(
    100.0 * COUNT(*) FILTER (WHERE http_response_status_code < 500)
         / NULLIF(COUNT(*), 0),
    4
  ) AS "availability_%",
  ROUND(
    (COUNT(*) FILTER (WHERE http_response_status_code >= 500)::double
     / NULLIF(COUNT(*), 0))
    / (1.0 - CAST($slo_goal AS DOUBLE)),
    2
  ) AS burn_rate
FROM records
WHERE array_has($service_name, service_name)
  AND http_response_status_code IS NOT NULL
GROUP BY service_name
ORDER BY burn_rate DESC
LIMIT 20
Add a status-code pie chart, an availability-over-time chart, and a request volume chart to complete the picture. Together the panels answer three questions in order:
- Is the SLO at risk right now?
- Which service is responsible?
- What does the traffic look like behind the numbers?
The dashboard tells you what is happening, but it does not wake anyone up. For that, we need alerts.
Configuring the alerts
These three are close to what a reliability target generates for you, written out. A Logfire alert is a SQL query that runs on a schedule (every minute, every five minutes, and so on). When the query returns rows, the alert fires and posts to the notification channel attached to it. When it returns zero rows, the alert is silent.
That zero-or-more-rows convention shapes how MWMBR alerts are written. The query must compute the burn rate over the long window and the short window, grouped by service, and return one row per service that is burning above the threshold in both windows. The row identifies the offending service directly in the alert payload, so on-call does not have to drill into the dashboard to find out which service triggered the page.
Page-level alert: 2% budget in 1 hour
WITH long_window AS (
  SELECT
    service_name,
    (COUNT(*) FILTER (WHERE http_response_status_code >= 500)::double
     / NULLIF(COUNT(*), 0))
    / 0.001 AS burn_rate
  FROM records
  WHERE start_timestamp > now() - INTERVAL '1 hour'
    AND http_response_status_code IS NOT NULL
  GROUP BY service_name
),
short_window AS (
  SELECT
    service_name,
    (COUNT(*) FILTER (WHERE http_response_status_code >= 500)::double
     / NULLIF(COUNT(*), 0))
    / 0.001 AS burn_rate
  FROM records
  WHERE start_timestamp > now() - INTERVAL '5 minutes'
    AND http_response_status_code IS NOT NULL
  GROUP BY service_name
)
SELECT
  long_window.service_name,
  ROUND(long_window.burn_rate, 2)  AS long_burn,
  ROUND(short_window.burn_rate, 2) AS short_burn
FROM long_window
JOIN short_window USING (service_name)
WHERE long_window.burn_rate  > 14.4
  AND short_window.burn_rate > 14.4
0.001 is 1 - SLO_goal for a 99.9% objective. Replace it for other targets (0.005 for 99.5%, 0.0001 for 99.99%).
Run this alert every minute. It will only return rows when at least one service is simultaneously burning faster than 14.4x in both windows, and the payload tells the on-call which service it is.
Page-level alert: 5% budget in 6 hours
Same shape, longer windows, lower threshold:
WITH long_window AS (
  SELECT
    service_name,
    (COUNT(*) FILTER (WHERE http_response_status_code >= 500)::double
     / NULLIF(COUNT(*), 0))
    / 0.001 AS burn_rate
  FROM records
  WHERE start_timestamp > now() - INTERVAL '6 hours'
    AND http_response_status_code IS NOT NULL
  GROUP BY service_name
),
short_window AS (
  SELECT
    service_name,
    (COUNT(*) FILTER (WHERE http_response_status_code >= 500)::double
     / NULLIF(COUNT(*), 0))
    / 0.001 AS burn_rate
  FROM records
  WHERE start_timestamp > now() - INTERVAL '30 minutes'
    AND http_response_status_code IS NOT NULL
  GROUP BY service_name
)
SELECT
  long_window.service_name,
  ROUND(long_window.burn_rate, 2)  AS long_burn,
  ROUND(short_window.burn_rate, 2) AS short_burn
FROM long_window
JOIN short_window USING (service_name)
WHERE long_window.burn_rate  > 6
  AND short_window.burn_rate > 6
Ticket-level alert: 10% budget in 3 days
For the slow leak that never crosses the page-level thresholds:
WITH long_window AS (
  SELECT
    service_name,
    (COUNT(*) FILTER (WHERE http_response_status_code >= 500)::double
     / NULLIF(COUNT(*), 0))
    / 0.001 AS burn_rate
  FROM records
  WHERE start_timestamp > now() - INTERVAL '3 days'
    AND http_response_status_code IS NOT NULL
  GROUP BY service_name
),
short_window AS (
  SELECT
    service_name,
    (COUNT(*) FILTER (WHERE http_response_status_code >= 500)::double
     / NULLIF(COUNT(*), 0))
    / 0.001 AS burn_rate
  FROM records
  WHERE start_timestamp > now() - INTERVAL '6 hours'
    AND http_response_status_code IS NOT NULL
  GROUP BY service_name
)
SELECT
  long_window.service_name,
  ROUND(long_window.burn_rate, 2)  AS long_burn,
  ROUND(short_window.burn_rate, 2) AS short_burn
FROM long_window
JOIN short_window USING (service_name)
WHERE long_window.burn_rate  > 1
  AND short_window.burn_rate > 1
Route this one to a ticketing channel, not a pager. On a high-volume service the 3-day scan can be expensive, so consider running this alert less frequently (every 15 to 30 minutes) and add a minimum-volume guard such as HAVING COUNT(*) > 1000 to each window to silence services with too little traffic to draw conclusions from.
Backtesting the alerts against past incidents
If you created a reliability target, the creation form previews it against recent data and shows the success rate and burn before you commit to it. What follows is the manual version, for alerts you write yourself and for going further back than the preview covers.
Before sending handwritten alerts to PagerDuty, run them against history. The cleanest place to do this is the SQL Explorer in Logfire, where you set the time range from the time picker in the UI instead of writing it into the SQL.
Pick a past incident, set the Explorer time range to a one-hour window ending at the moment the alert would have evaluated, and run the long-window query without any time filter:
SELECT
  service_name,
  COUNT(*) AS total,
  COUNT(*) FILTER (WHERE http_response_status_code >= 500) AS errors_5xx,
  ROUND(
    (COUNT(*) FILTER (WHERE http_response_status_code >= 500)::double
     / NULLIF(COUNT(*), 0))
    / 0.001,
    2
  ) AS burn_rate
FROM records
WHERE http_response_status_code IS NOT NULL
GROUP BY service_name
ORDER BY burn_rate DESC
The UI time range becomes the long window, so the rows that come back are exactly what the long-window CTE in the alert would have produced at that moment. Compare each burn_rate against the corresponding threshold (14.4 for the 1-hour tier, 6 for the 6-hour, 1 for the 3-day).
To check the short window, shrink the time picker to the matching span (5 minutes, 30 minutes, or 6 hours) and re-run the same query. The alert fires only when the burn rate exceeds the threshold in both ranges, so the backtest succeeds when both queries return the offending service above the threshold and quietly when at least one does not.
This is also a useful way to argue about thresholds with the rest of the team. Rather than picking numbers from the workbook and hoping, you can scrub the time picker across the last month of production traffic and show what each setting would have caught and what it would have ignored.
FAQ
Should I use a reliability target or write the SQL?
If your plan includes a target, start with one. You get up to three burn-rate tiers without the CTEs, and the creation form backtests the goal against real traffic before you commit to it. Targets are limited on the Growth plan, so spend them on the journeys that page someone.
Reach for SQL for everything else: services beyond that allocation, thresholds other than the three built-in speeds, or when you want to read the arithmetic. Nothing stops you running both against the same service.
How do I pick the SLO goal?
Start by measuring your current availability over a quiet month, then pick a goal slightly below that number. An aspirational SLO that nobody can defend gives you nothing actionable; a realistic one gives the team a budget they can actually spend.
Can I run this on metrics instead of spans?
Yes. The same arithmetic works on a counter of requests by status class. Spans are usually easier because the dashboard doubles as the drill-down: when an alert fires, the same query filtered to the bad window returns the actual failing requests.
What if my SLI is latency, not availability?
Change the "good event" filter and pin the query to the spans you actually want to measure.
Restrict the SLI to a specific span by name:
SELECT
  ROUND(
    (COUNT(*) FILTER (WHERE duration >= 0.3)::double
     / NULLIF(COUNT(*), 0))
    / (1.0 - CAST($slo_goal AS DOUBLE)),
    2
  ) AS burn_rate
FROM records
WHERE array_has($service_name, service_name)
  AND span_name = 'GET /api/search'
  AND duration IS NOT NULL
duration < 0.3 is the new "good event"; span_name = 'GET /api/search' pins the SLI to the request you care about. The burn-rate math and the alert structure are otherwise unchanged.
Should I alert on availability directly?
A direct availability threshold ("page if availability < 99.9% in the last 5 minutes") collapses to a burn-rate alert with a single window. It will be noisy. The multi-window approach is strictly better.
What about alerting on the error budget itself?
A "budget remaining < 10%" alert is a useful complement to burn-rate alerts: it catches the case where the budget is nearly exhausted from accumulated small failures, even though the current burn rate is fine. It will not catch fast incidents in time, which is why you still want the burn-rate alerts as well.
Get started
Logfire's free tier includes 10M records per month, enough to back an SLO dashboard for a real service.
- Sign up: logfire.pydantic.dev
- Instrument an HTTP service: any service that records
http_response_status_codeon its spans will work with the queries above. The Logfire docs cover the standard OpenTelemetry instrumentations. - Build the dashboard and alerts from the SQL above. This is the path on the free tier, and it computes the same SLO the built-in feature does.
- If your plan includes a reliability target, set one instead: open Service levels, click New target, and pick a goal. Read the live preview before you save. If it says the target would have paged 26 times yesterday, that is the conversation to have now rather than at 3am.
- Attach channels and watch it for a week before tuning anything.
- Questions or feedback: reach out on Slack.
The dashboard is for retrospectives and weekly reviews. The alerts are what on-call sees at 3am, so they are where tuning effort pays back the fastest.