The following is a guest post from Tiger Data
Tiger Data is a fully remote company; we have employees all across the globe working across time zones. As a result, Slack is where the entire company operates. We make decisions, discuss project details, and share context on Slack 24/7.
But a problem quickly arises with all company conversations happening on Slack – after a certain company size, it becomes nearly impossible for folks to catch up and gain context (no pun intended) on what’s happening.
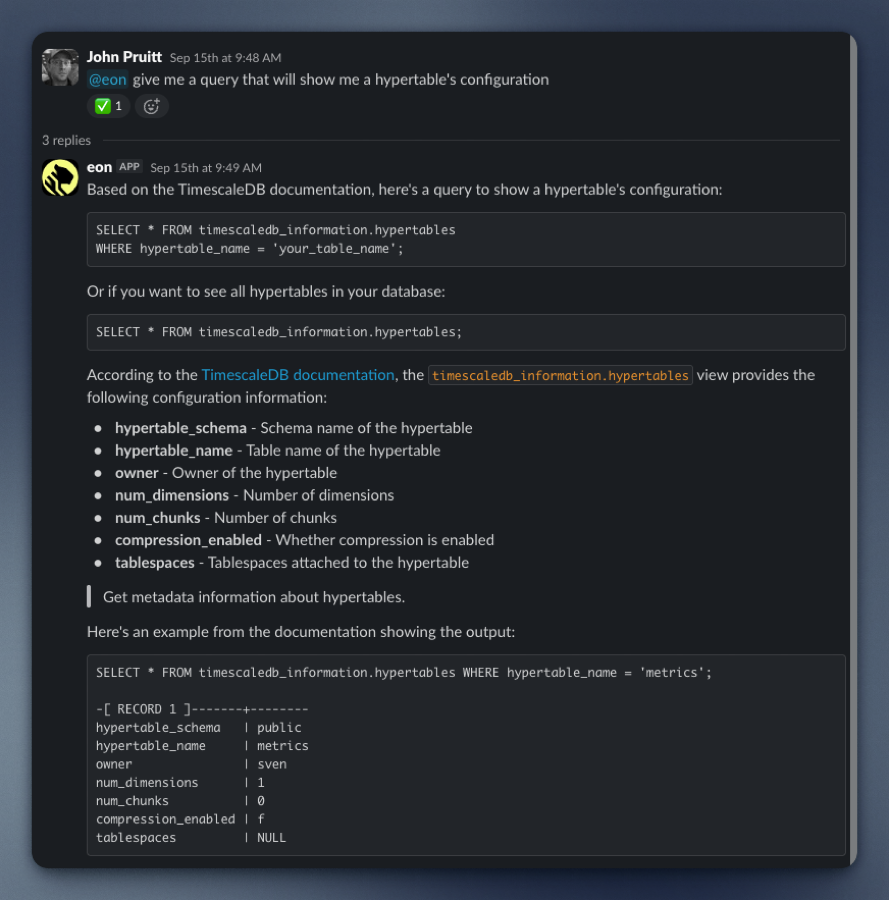
We needed a way to surface relevant context instantly, without engineers drowning in channel history. So we built Tiger Agent for Work, a production AI Slack bot that handles thousands of concurrent conversations at Tiger Data with its own memory, context, and production-grade reliability. Within 6 weeks, more than half of the company uses it daily.
When building Tiger Agent, we wanted to ensure engineering quality so the application would be reliable and usable by our team. We then deliberated on the best tools that could provide what we expected for our solution.
After assessing quite a few options (including building our own LLM library), we picked Pydantic AI for LLM abstraction and Logfire for observability.
Let us show you why Pydantic AI and Logfire became our go-to tools for building production AI agents with comprehensive observability.
TL; DR
- Built production AI Slack bot handling thousands of conversations
- Chose Pydantic AI for LLM orchestration and MCP server integration
- Implemented Pydantic Logfire for distributed tracing and AI observability
- Reduced debugging time with Pydantic AI's "Agent Run" visualization
The problem of building AI agents without a framework
Building an AI agent framework means dealing with LLMs, but the actual LLM call itself is only one very small piece of the overall system. You need tool integrations, retry logic, provider switching, production debugging, and comprehensive logging. Do this from scratch and you'll write thousands of lines of scaffolding just to get started. We integrated eight MCP servers (as of now) into Tiger Agent: Slack search, customer docs, Salesforce cases, GitHub repos, Linear tickets, meeting transcripts, user memory, and progress reports. Each server provides tools the agent calls to answer questions about Tiger Data's products and customer issues.
Without a framework, you're writing protocol handlers, format converters, and retry logic for every server. That's a lot of plumbing code that has nothing to do with your Slack agent.
Pydantic AI allows abstraction without vendor lock-in
Pydantic AI handles the tedious parts while staying out of our way.
MCP servers that just work
Adding a server to Tiger Agent means dropping a few lines into mcp_config.json:
"docs": {
  "url": "http://tiger-docs-mcp-server/mcp"
}
After this, we load Pydantic AI config, connect to servers, fetch tool definitions, and translate them for whatever LLM provider we're using.
In tiger_agent/agent.py:
mcp_servers = self.mcp_loader()
self.augment_mcp_servers(mcp_servers)
toolsets = [mcp_server for mcp_server in mcp_servers.values()]
agent = Agent(
    model=self.model,
    deps_type=dict[str, Any],
    system_prompt=system_prompt,
    toolsets=toolsets
)
That's it. The agent now has access to all our eight MCP servers. No need for special protocol handling, format conversion, or retry logic. When we started building Tiger Agent, we were simultaneously developing MCP servers we wanted to plug into it. We had already used Pydantic AI for our text-to-SQL implementation in our pgai Python library, where it let us switch providers and models with a CLI argument or environment variables instead of writing separate implementations for Anthropic, OpenAI, and Cohere. It was a library, not a framework.
Another killer feature: Pydantic Logfire has an MCP server that lets you query all tracing data with SQL. Connecting it to Claude Code is a one-liner:
claude mcp add logfire -e LOGFIRE_READ_TOKEN="your-token" -- uvx logfire-mcp@latest
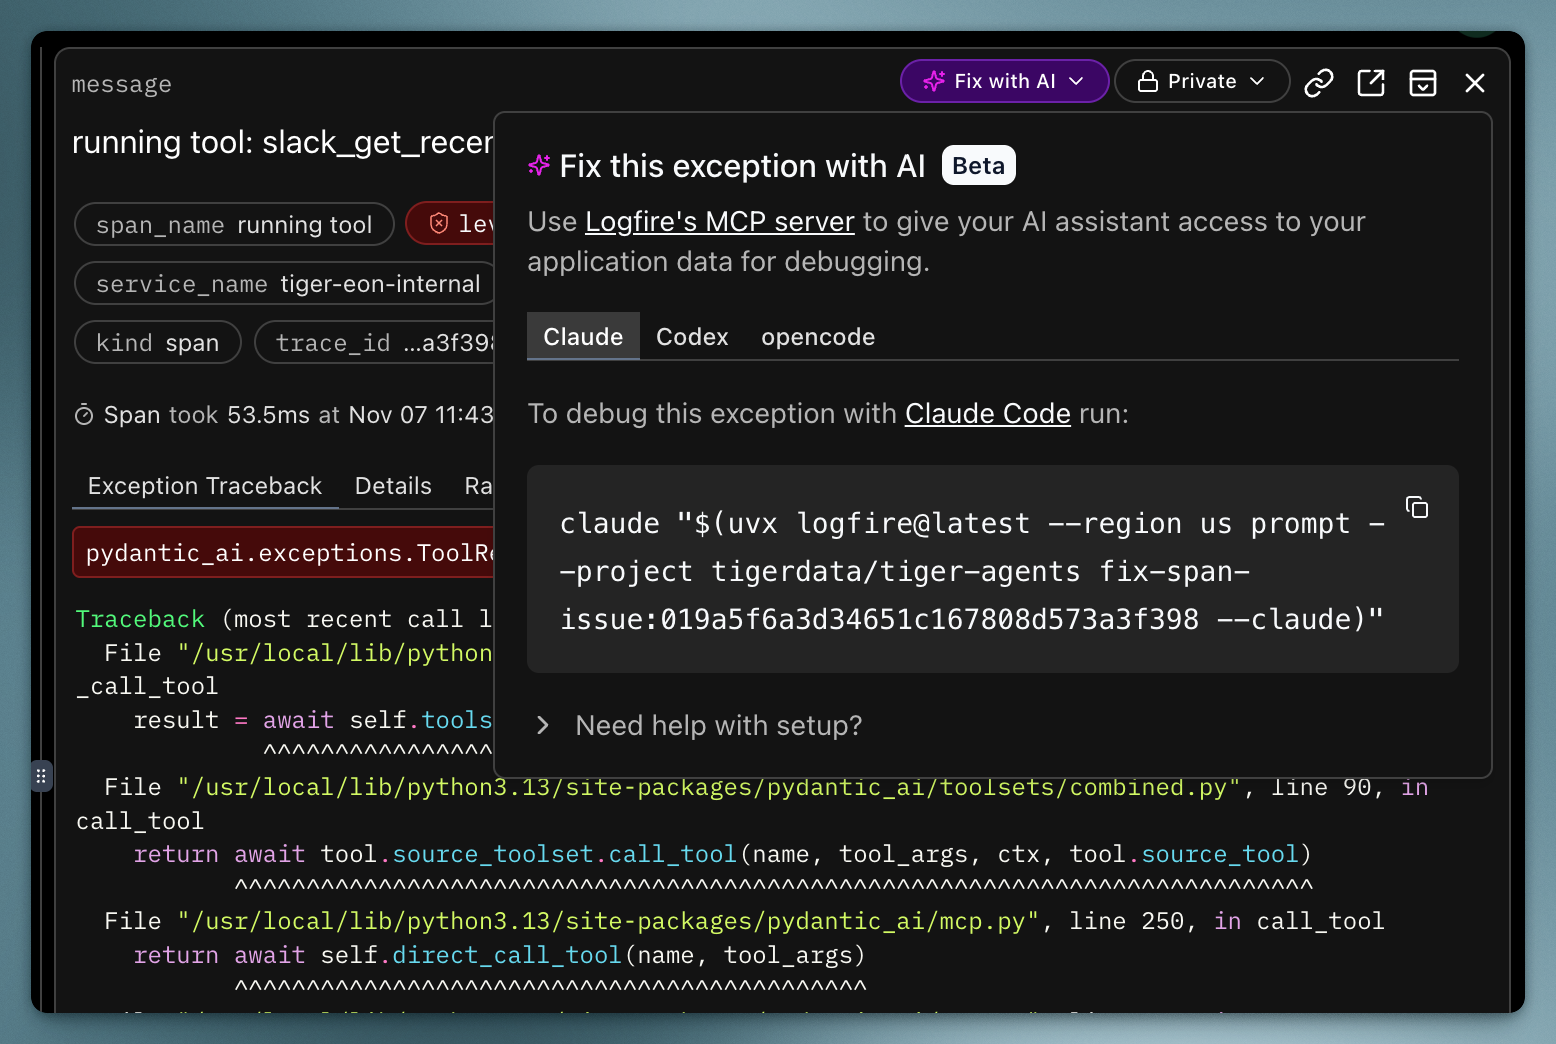
Now, when we see an error span in Logfire, we click the "Fix with AI" button, and it gives us a command to tell Claude Code to fix it.
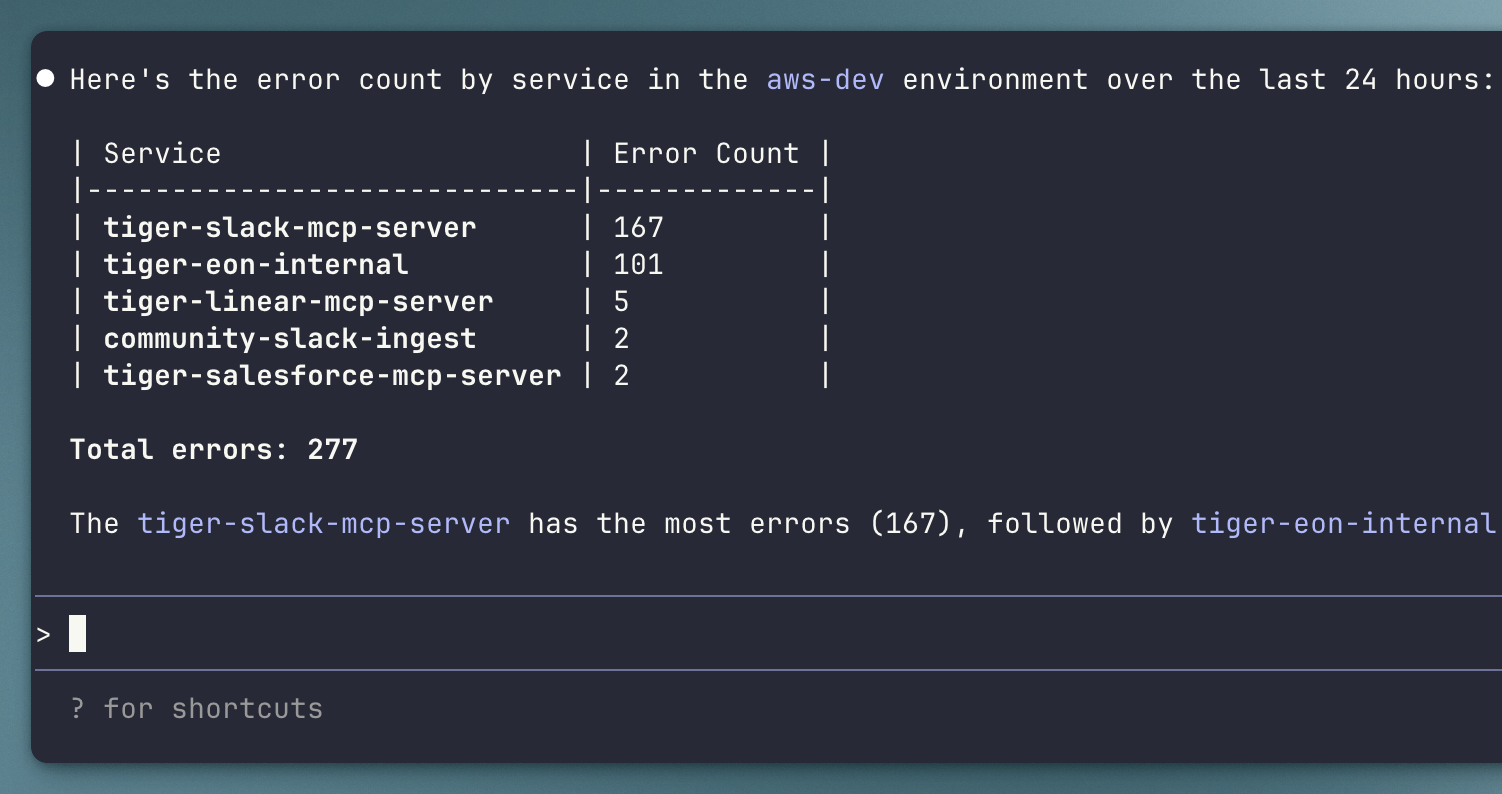
We can also ask broader questions like "take a look at the error spans in Logfire over the last 24 hours. Give me a count of errors by service in the aws-dev environment." It queries the tracing data with SQL and tells us what's happening.
Retries are automatic
MCP servers fail. Networks hiccup. Rate limits hit. Pydantic AI retries tool calls by default. We don't need to manually write retry logic. It works out of the box.
Switching LLM providers is so easy
Each LLM has its own behavior, uptime, reliability, context window, cost, and proficiency in agentic tasks. It is actually not an easy problem to “decide” on what model to use until you’ve tested them extensively both in development and production.
We started with a Claude model, switched to OpenAI’s GPT-4o, then back to Claude 4.5 Sonnet. Each time, we only had to change one environment variable: MODEL_NAME=claude-sonnet-4.5 or MODEL_NAME=gpt-4o. Pydantic AI translates between provider APIs automatically. This is a really big deal because it saves our engineering team the time of re-implementing how each model company calls their models. This abstraction layer saved us not just a significant amount of development time, but also helped us seamlessly switch providers when a model inevitably is temporarily unavailable - we’re looking at you Claude API.
Acceptable amounts of opinionation
Every library is opinionated to some degree, and obviously, Pydantic AI isn’t any different. However, we were able to work with the opinionation and felt it made sense. Tiger Agent runs on a PostgreSQL-backed work queue with atomic event claiming and horizontal scaling. Pydantic AI plugs into this architecture cleanly because it doesn't force us into a different event model. It’s more a library for the LLM/agent bits as opposed to an opinionated framework for our entire project.
Why distributed tracing is essential for production AI systems
We started building without any tracing. This turned out to be a very bad idea, because we found it very difficult to reason over what an agent is doing in production AI systems.
Many things can go wrong in an agentic system. Maybe the model failed to call a tool when it should have. Maybe it passed in poor or incorrect args. Maybe the tool has a bug or returns a bad response. Maybe the model called a tool it shouldn’t have and got confused.
From the user’s perspective, without tracing, you only see the final output. You don’t see any of the intermediate steps. Even if we put logging in our own code, we can’t log inside the agentic framework. We have at least nine services that may all produce logs for any given request, and you’d really like to see them together, in chronological order. Doing this manually is a herculean task.
Many things can go wrong, and without tracing, you are essentially trying to find a bug without a debugger or console logs.
We knew distributed tracing would really help us here and landed on OpenTelemetry. We did try Jaeger first, and it technically worked, but the developer experience was poor. We then tried Pydantic Logfire because it integrated really well with Pydantic AI. Since the interface was instantly better, we decided this was what we were going to stick with.
How Logfire provides helpful observability and tracing
Observability for AI agents is hard. You need to see what the LLM is doing, what tools it's calling, and what responses it's getting. The Pydantic Logfire platform treats this as structured data, not unstructured logs.
Instrumentation
We instrumented our database layer (psycopg), AI framework (pydantic_ai), MCP connections (MCP), and HTTP requests (httpx) with just a few lines.
logfire.configure(
    service_name=os.getenv("SERVICE_NAME", service_name),
    service_version=__version__,
)

logfire.instrument_psycopg()
logfire.instrument_pydantic_ai()
logfire.instrument_mcp()
logfire.instrument_httpx()
Then we added @logfire.instrument decorators to functions we wanted to trace. Total setup time took less than one hour.
Traces show everything
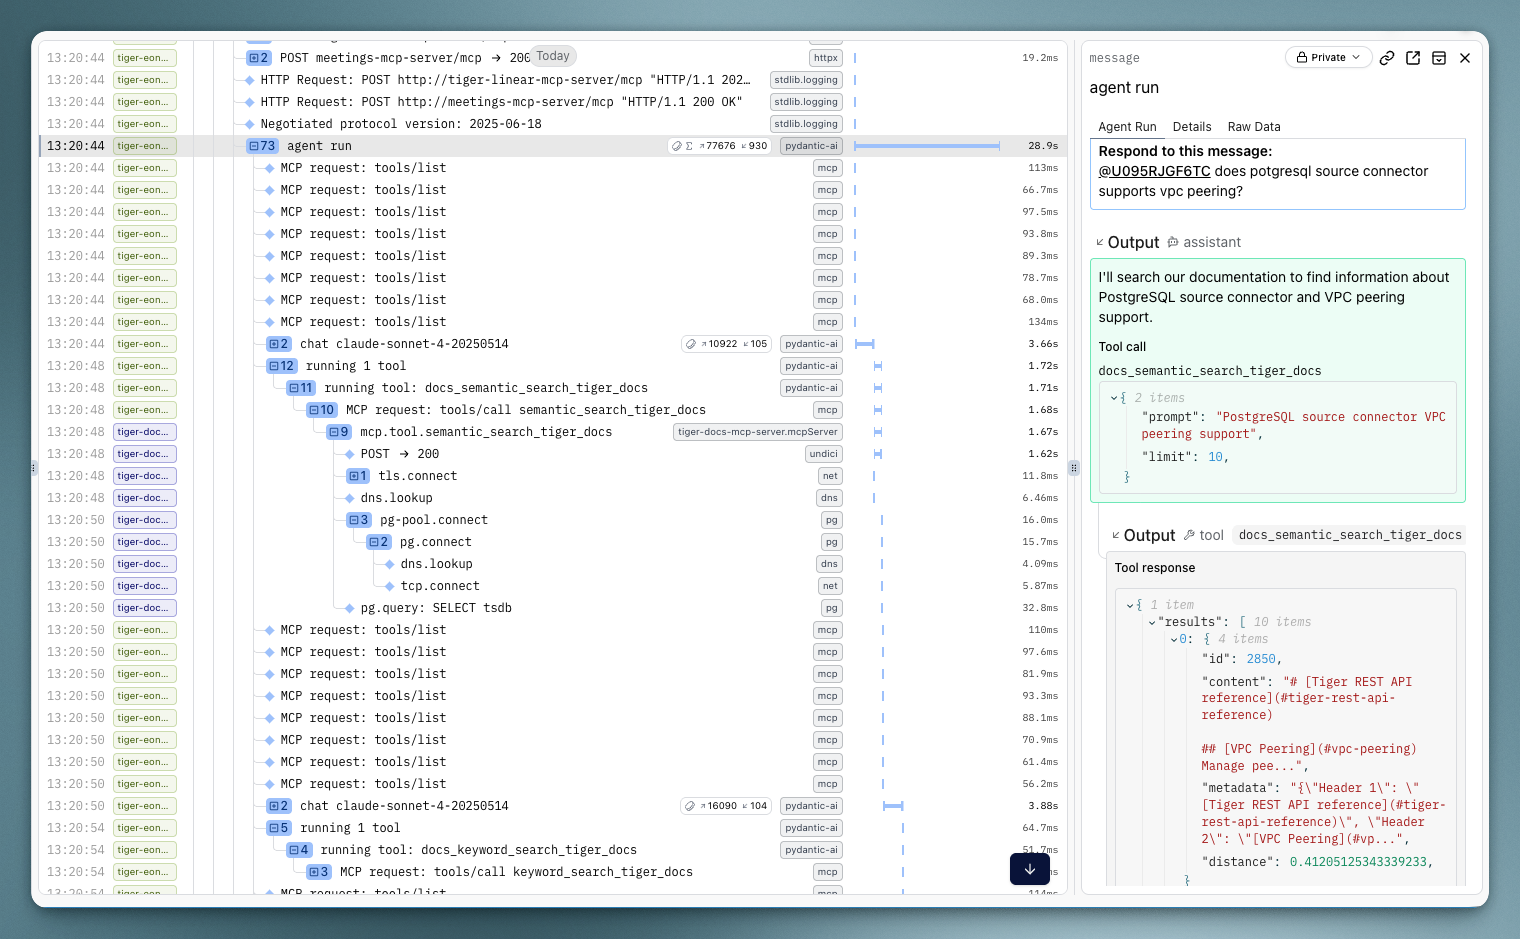
When Tiger Agent responds to a Slack mention, Pydantic Logfire captures each tool call, its arguments, response, and latency.
For LLM calls, it shows the system prompt, user prompt, all tool interactions, and the final response – something Pydantic AI calls the “Agent Run”. This was quite a magical experience for us because it made the entire LLM and tool workflow super easy to read and understand, really helping with traceability and observability. Even better, this happens automatically because Pydantic AI instruments itself for Pydantic Logfire.
We had been writing custom tooling to do a hacky version of what Agent Run does, and that just wasn’t it. If you’ve built any slightly complex agentic workflow, you’ll realize just how nice it is to be able to observe this granular flow.
Debugging with SQL beats custom query languages
To find all agent runs that called our documentation search tool, we ran the SQL query below:
span_name = 'agent run'
AND (
    attributes->>'pydantic_ai.all_messages' LIKE '%semantic_search_postgres_docs%'
    OR attributes->>'pydantic_ai.all_messages' LIKE '%semantic_search_tiger_docs%'
)
Other tracing tools have custom query languages. Logfire uses SQL. Engineers already know SQL. The spans are stored as rows with JSONB attributes.
Pydantic AI and Logfire work very well together
The integration between Pydantic AI and Logfire is what makes this powerful. Pydantic AI has first-class Logfire support, so all LLM calls, tool invocations, and MCP server interactions are automatically instrumented. We didn't write code to log tool calls or capture LLM responses. We called logfire.instrument_pydantic_ai() and it worked.
The full workflow
When a Slack mention event comes in, the agent loads MCP servers from configuration, creates a Pydantic AI agent with those servers as toolsets, runs the agent with a user prompt, and returns a response. Pydantic AI calls the LLM, handles tool invocations, retries failures. Logfire captures every step.
The code is concise because Pydantic AI handles the mechanics and Logfire captures everything without manual instrumentation.
Get started with Tiger Agent
Tiger Agent for Work is open sourced on Github. The repository includes full integration examples, MCP server configuration, PostgreSQL-backed work queue for horizontal scaling, and Jinja2 templates for dynamic prompts.
Documentation:
- Pydantic AI: pydantic.dev/docs/ai
- Logfire: pydantic.dev/docs/logfire
- MCP protocol: modelcontextprotocol.io
If you're building AI agents for production, start with tools that abstract the boring parts and give you visibility into what's happening. Pydantic AI and Logfire do both without locking you into a specific architecture.
