It is pretty common to see benchmarks of new Python web frameworks popping up from time to time, often without actually representing real use cases. Within a web request to one of your backend endpoints, many things can happen (on top of the framework's own logic and data validation): cache and/or database queries, requests to external services, processing of data, etc., and I always wondered if the speed of the framework really matters in practice.
In this blog post, we are going to use our observability platform, Pydantic Logfire to investigate what usually takes longest in a web request.
Table of Contents
Setting Up the Experiment
To achieve this, we are going to use FastAPI, and define a dummy POST endpoint that will validate data from the request's body, perform a SQL query to a local SQLite database, and return the body unchanged. We're going to instrument our app using Logfire to get a sense of where time is being spent:
from pydantic import BaseModel
from fastapi import FastAPI, Body

import logfire

app = FastAPI()

logfire.configure(token='pylf_v1_...')

logfire.instrument_fastapi(app)
logfire.instrument_sqlite3()
# As FastAPI uses Pydantic to validate the body:
logfire.instrument_pydantic()


# Using LLMs is really useful to generate dummy nested models like this:
class Data(BaseModel):
    customer: Customer
    items: list[OrderItem]
    payments: list[Payment]
    notes: list[str]
    priority: int = Field(ge=1, le=10)
    scheduled_time: time | None
    # More nested fields
    ...


@app.post('/test', response_model=Data)
async def test(body: Annotated[Data, Body()]):
    query_results = run_sqlite_heavy_query()
    return body
Not shown in the code snippet, but run_sqlite_heavy_query() is defined as making a SQL query using sqlite3 file database
(filled with a few thousand rows), and making a query involving multiple joins 1.
Profiling a Heavy Payload
We then use our favourite LLM to generate a cURL command with sample data to be sent (~100 JSON objects, structured in a way that matches our Data Pydantic model), and see
what happens on Logfire:
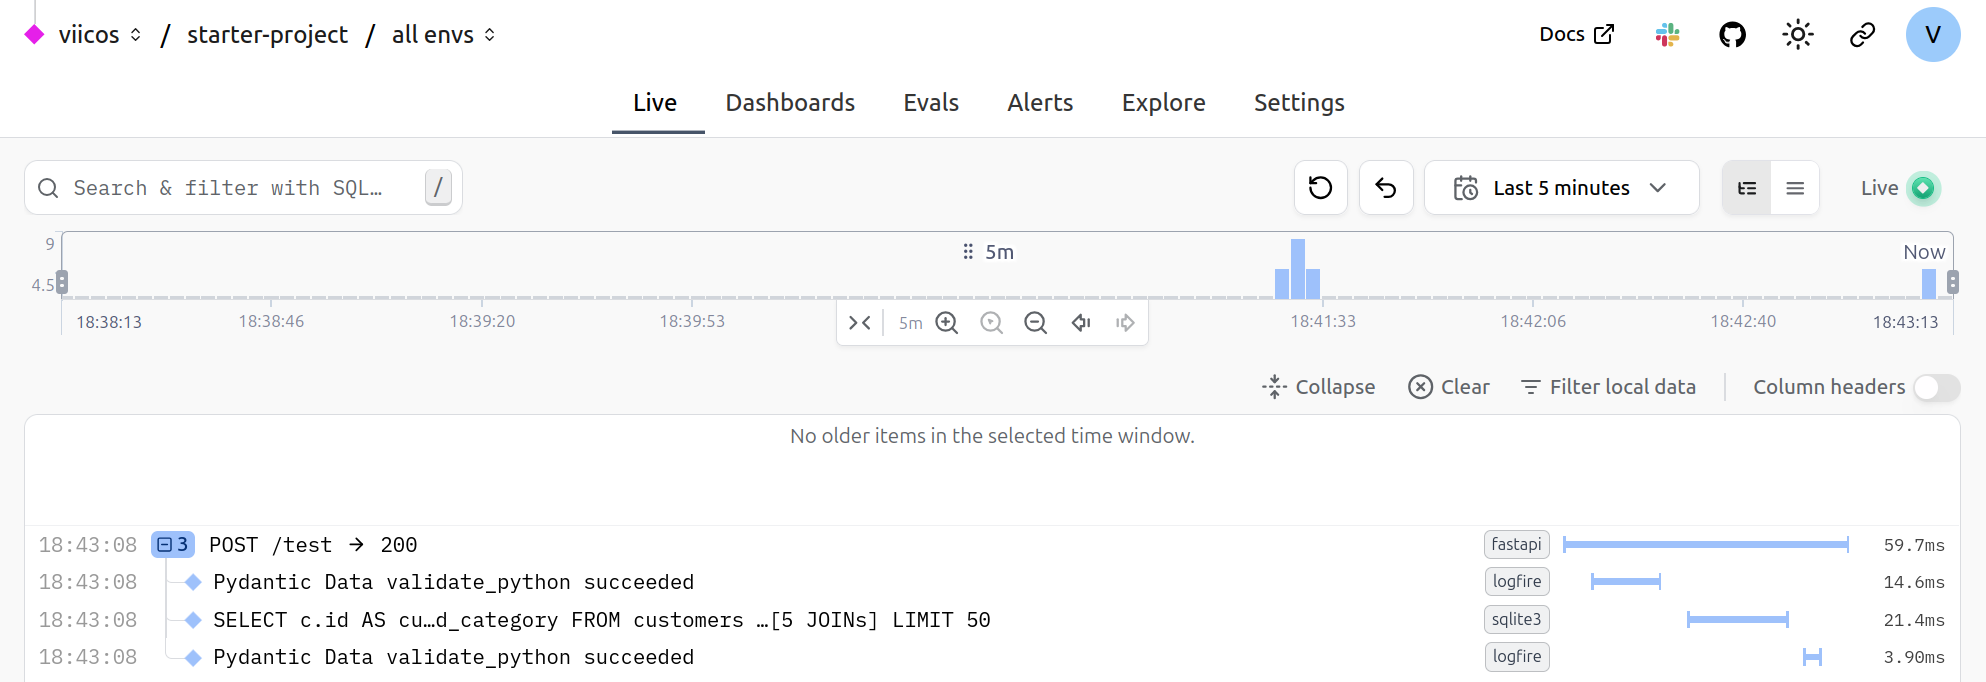
As FastAPI is instrumented by Logfire, a root span is created and wraps the whole execution of the request. This allows us to get a clear breakdown of what is happening:
- The first span is the validation of the JSON payload to produce a
Datainstance. - The second span is the SQL query being run.
- The third span is the validation of the returned data. It is way faster than the input validation, as Pydantic does not re-validate instances by default 2.
You will notice the small gaps between each span, which presumably is time being spent in the actual FastAPI logic (routing, etc). We can see from the experiment that with a relatively large JSON payload and expensive query, a really small amount of time is being used by the actual web framework.
Profiling a Light Payload
Now when doing performance measurements, relativity is what matters: FastAPI's own logic is insignificant compared to the data validation/DB query in our example, but might not be
if we reduce the size/complexity of the payload/query. To test this, we define a /test-light endpoint, reducing the payload and query complexity:
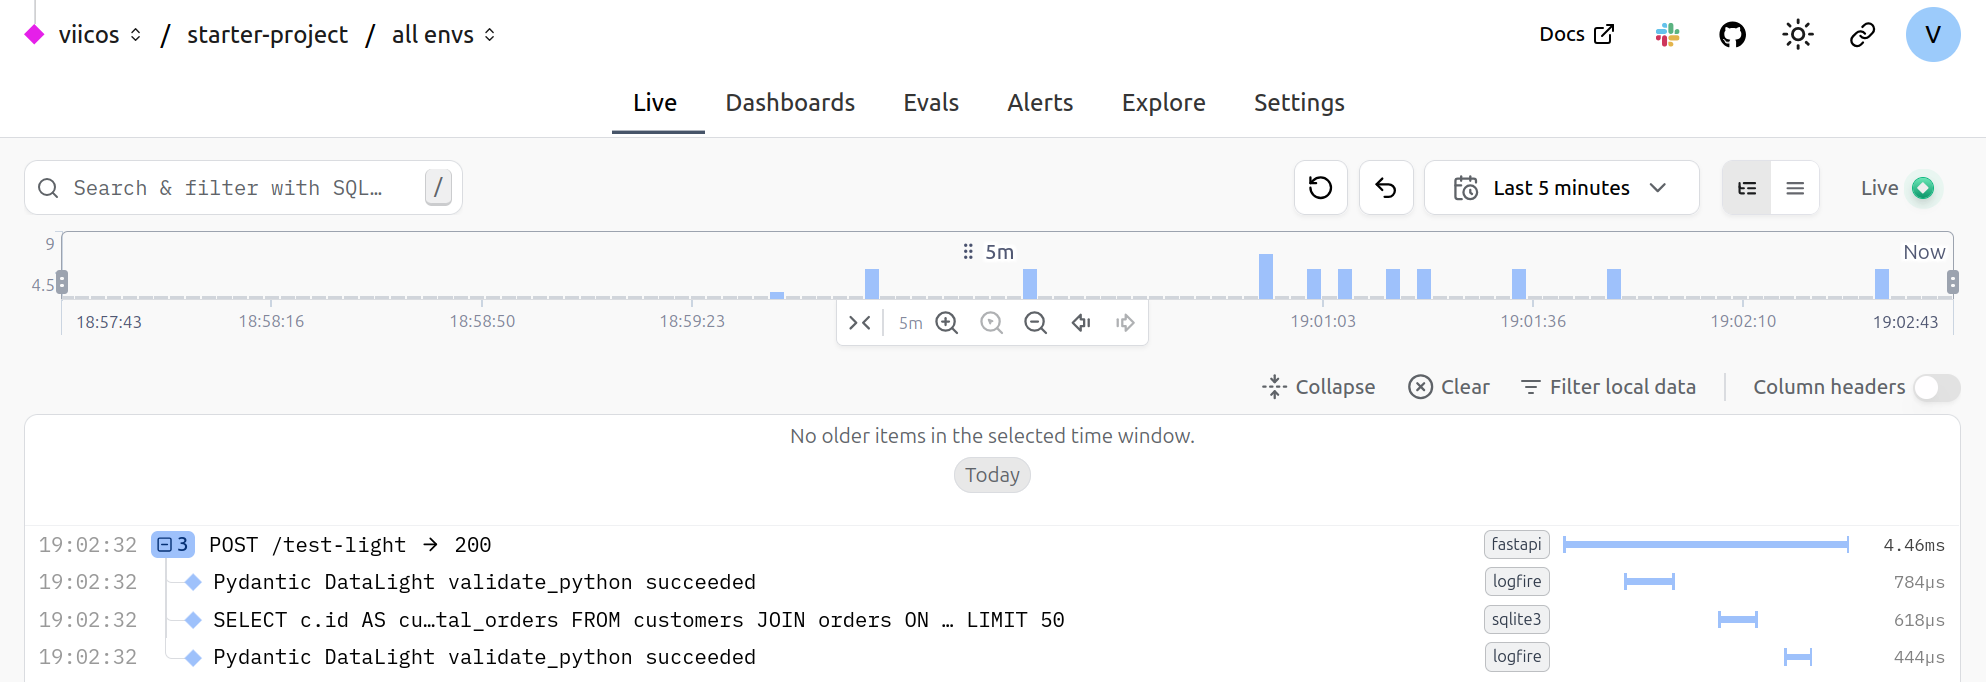
Now it seems like the gaps between the spans are more noticeable. I got curious, and wanted to see where that time was being spent: I took a dive into the fastapi
logic, and wrapped some parts of the routing logic with Logfire spans, and added some logs as well. Here is the result:
Where Does FastAPI Actually Spend Time?
Note that to try matching a real FastAPI app, I artificially registered a thousand dummy routes, so that the route matching logic would actually be realistic. What I noticed is that most of the time is spent in things "outside of FastAPI's control". The request's body is first being parsed as bytes, then as JSON 3, the actual run of the endpoint function is almost all about running the SQL query, and a bit of time is spent serializing the response body.
Some non-negligible time is spent in the route matching, so it may be worth looking into it, and see if it can be optimized.
More importantly, we can easily deduce that the framework on its own is rarely going to be the bottleneck. Also note that this was all run locally, and so does not account for any latency between the client and the server.
Conclusion
Our experiment with Pydantic Logfire shows that Python web framework overhead is typically negligible compared to real application work like data validation, database queries, and response serialization. Even with a lighter payload and simpler query, FastAPI's own routing and request handling accounted for only a small fraction of the total request duration.
Before reaching for a "faster" framework, consider profiling your actual application with an observability tool like Logfire. The bottleneck is likely in your application logic, not the framework, and distributed tracing can help you pinpoint exactly where.
Source code for this experiment.
Footnotes
-
As we mentioned, this isn't representative of a real deployment as this does not account for any latency to access the database, but should still be relatively accurate. ↩
-
You will want to use the
revalidate_instancesconfiguration value to do so. ↩ -
FastAPI currently relies on Starlette, which in turn unconditionally uses the standard library
jsonmodule to parse the body. One interesting experiment would be to use Pydantic's native JSON validation instead, directly as part of the validation step. ↩
