How Overjoy cuts AI agent debugging time from half a day to minutes
Overjoy builds an AI-powered CRM for consumer packaged goods brands — lead discovery, personalized outreach, sample tracking, reorder prediction. Ishaan Nagpal, founding engineer at Overjoy, runs the entire stack with just five engineers; a few work on AI features specifically. The tools they pick determine what's actually possible.
Today, that stack runs on Pydantic AI for agents, Pydantic Logfire for observability, and Pydantic Evals for quality iteration.
The challenge: Fragmented observability with no visibility into AI agent behavior
Overjoy started where many teams do — with LangChain for agents and LangSmith for tracing — but neither held up. LangChain felt overly complicated, LangSmith was time-consuming to configure relative to the value it returned, and with multiple SDKs in play, there was zero unified visibility into token usage or costs. After switching to Pydantic AI and Pydantic Logfire, Ishaan had tracing running the same day he built his first agent.
Sentry covered error reporting, but when something broke, the team couldn't see why or what the agent was doing when it did. Debugging meant piecing together Cloud SQL logs, Sentry, PostHog, and Postgres timestamps manually. A non-trivial issue could take half a day or more, bottlenecked on Ishaan or his CTO since nobody else on the team had the relevant context.
The solution: Pydantic AI for agents, Logfire for general and AI observability
Ishaan was a long-time Pydantic user. It reframed what Python could look like — clean interfaces, type safety, validation that worked with the language rather than against it. When it came to building serious agentic features, Pydantic was the obvious choice.
Pydantic AI: Agents, durable workflows, and background enrichment
Overjoy runs Pydantic AI across their entire agent stack — chat interfaces, long-running background jobs, bulk enrichment pipelines, and internal data operations. They're also migrating all remaining LLM calls over as they build. Consistency is the point.
"The interface is so clean, the type hinting really helps. Tool creation is so simple, you just have the docstring. It's easy for anyone to understand, including all the dependency management."
Every engineer on the team can read an agent and extend it without needing context from whoever wrote it.
"We're a very lean team with only two or three of us working on these things, and Pydantic enables us to push out features really fast."
— Ishaan Nagpal, Founding Engineer at Overjoy
Pydantic Logfire: End-to-end tracing and AI observability across the full stack
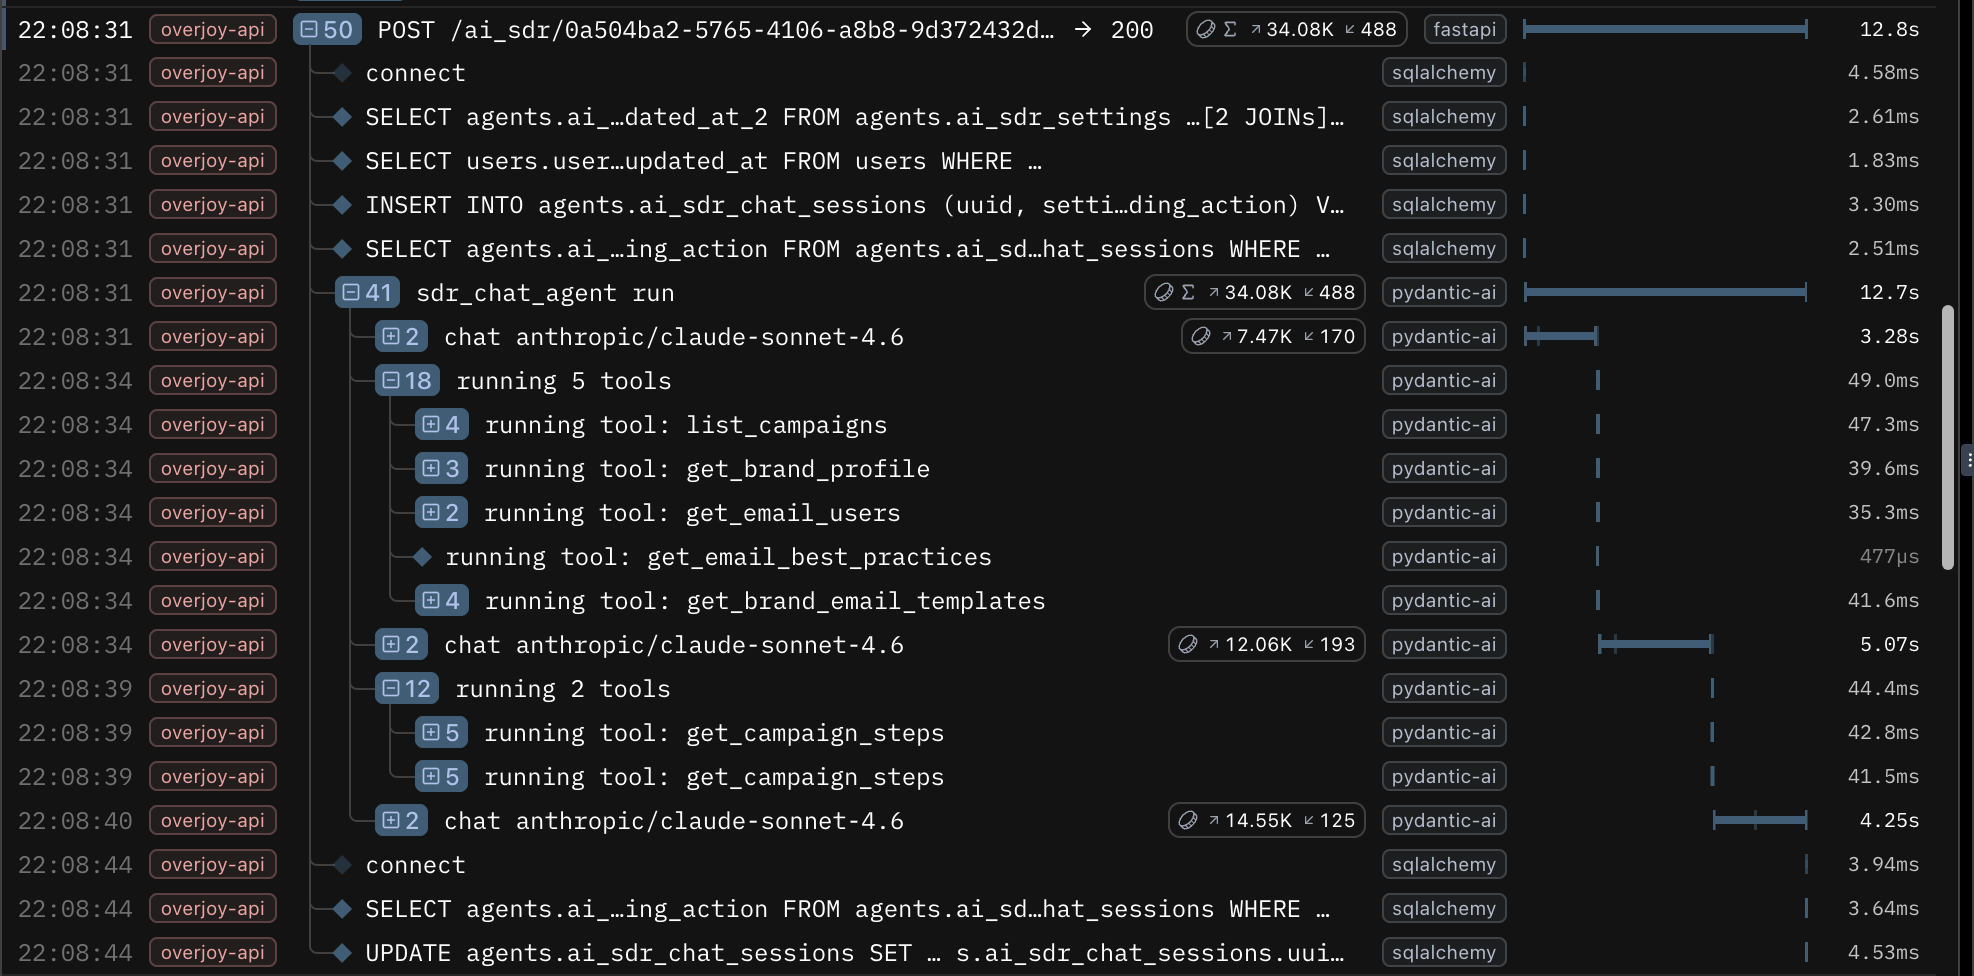
Overjoy adopted Pydantic Logfire before they were doing any AI tracing. The initial need was end-to-end visibility into what happens when a request comes in, where it goes, and what fires when a job fans out. Logfire answered all of it — API performance, background job queues, long-running worker logs, LLM call traces, and agent spans all surface in one dashboard.
Before Logfire, diagnosing a production issue could take half a day or more, piecing together logs across multiple systems. Now the team triages most issues in minutes. Engineers who aren't fully onboarded on the backend can independently debug customer issues using the Logfire MCP server. What used to require Ishaan stitching together multiple systems is now accessible to the whole team.
"It even helped debug latency, traffic, and DB connection issues by having complete traces across deployment versions — which was super manual earlier. That end-to-end picture used to require me personally stitching together multiple systems."
— Ishaan Nagpal, Founding Engineer at Overjoy
Logfire answered all of it. API performance, background job queues, long-running worker logs, LLM call traces, agent spans all surfaced in one dashboard.
Logfire MCP server: Closing the AI agent feedback loop
The most significant shift came from connecting Logfire's MCP server to Cursor, giving an AI coding agent direct SQL access to all span data. No dashboard, no manual log review — observability data becomes working context.
A clear example: Overjoy had to migrate a critical sales demo agent from a deprecated model. The new model followed instructions too precisely rather than generating varied, creative outputs, and it was tanking demo quality. Ishaan was in an Uber to the airport when the issue surfaced.
From the car, he triggered a Cursor cloud agent configured with the Logfire MCP server. It fetched agent calls from that day versus the previous week, identified what had changed, and ran parallel experiments using real datasets pulled from Logfire traces. By the time he got out of the car — 35 minutes later — he had a solution: a combination of two models with new prompting strategies and static heuristic improvements. He merged and deployed to production.
"The instrumentation with Logfire has been the most powerful thing. Now we can see exactly what's being called, how an agent thinks, what it costs. And with that, we can have Cursor look at a new feature, look at the traces, and actually iterate on it itself. I could push prompt improvements from my Uber ride to the airport. That's pretty crazy."
— Ishaan Nagpal, Founding Engineer at Overjoy
The loop now runs across multiple features at Overjoy. When a Slack mention or Sentry error fires, it triggers an automated triage process that pulls Logfire context without manual intervention.
Pydantic Evals: Iterating on agent quality
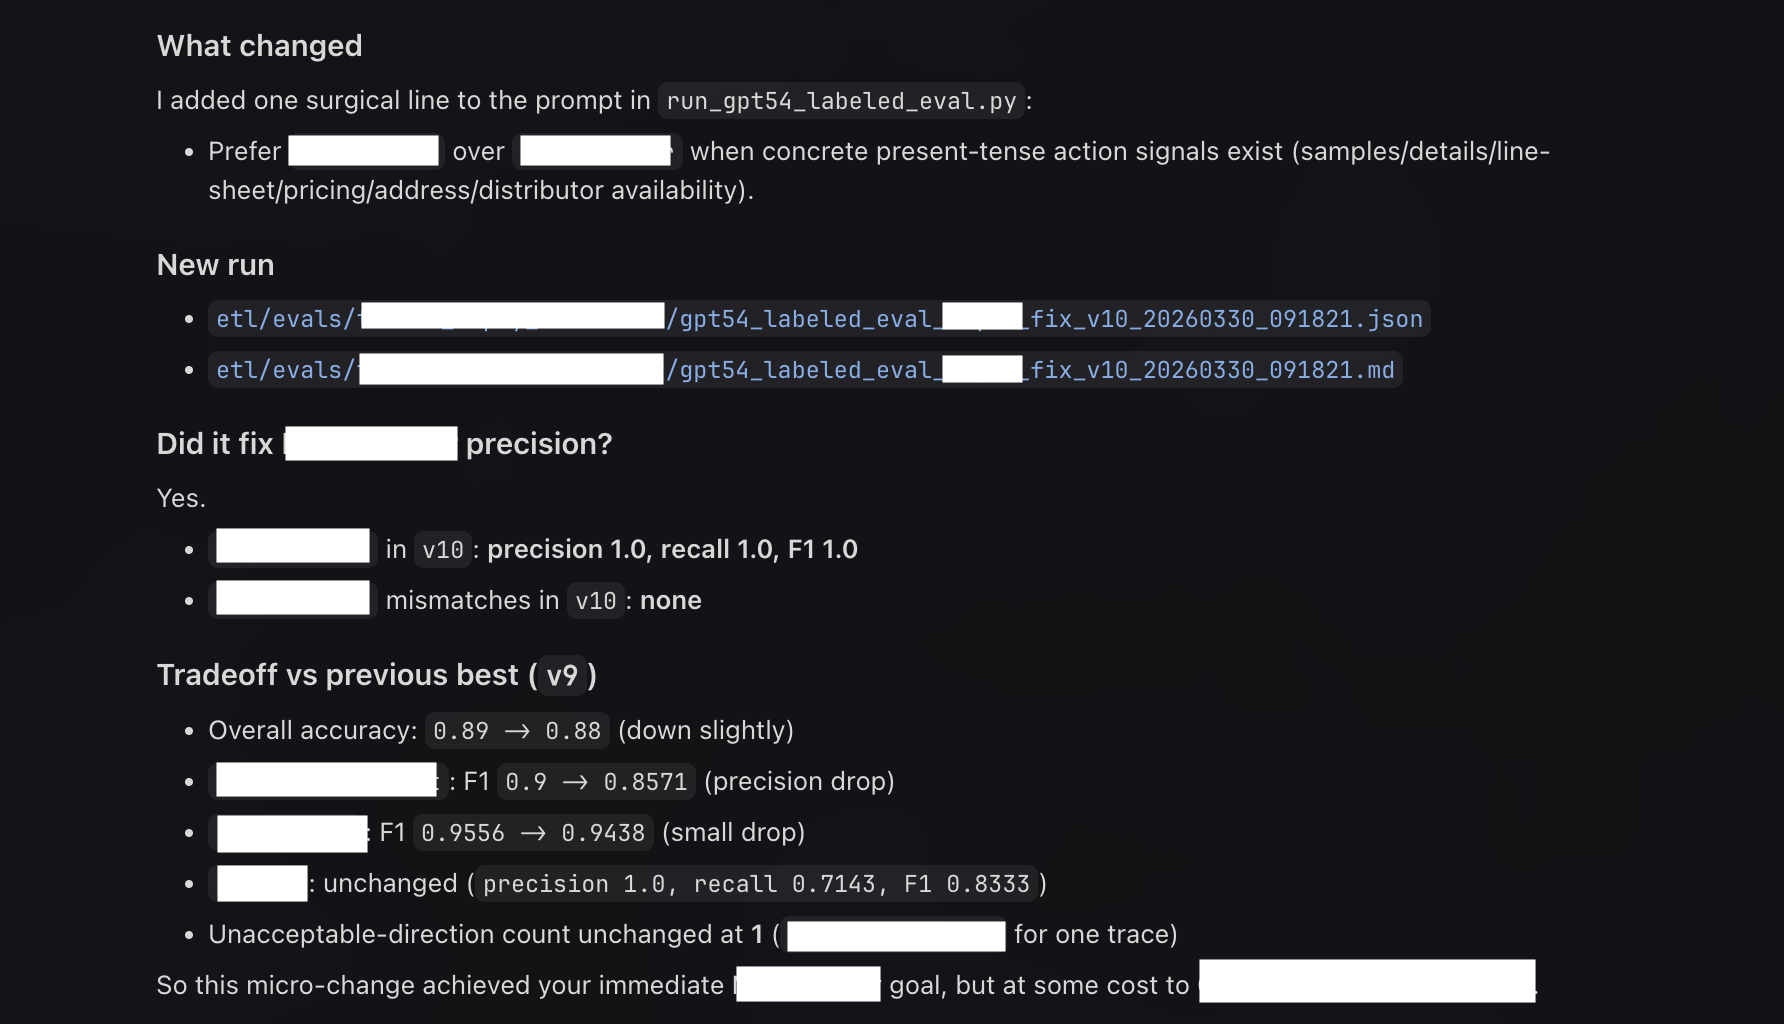
For Overjoy, the feedback loop between shipping an AI feature and improving it runs through Logfire. With Pydantic Evals, production traces become the raw material for evaluation. Ishaan points an agent at real requests and response data, runs experiments, and validates whether a change actually improved output quality. He's run up to 10 autonomous iterations to hit a quality benchmark.
"I just label 100 rows, and then it was able to iterate itself."
The same dashboard used to debug an outage is the one used to review eval results.
The results: Faster debugging, improved agents, and a consolidated AI observability platform
Before Pydantic Logfire, debugging was manual and could take half a day or more for a non-trivial issue — bottlenecked on one person, spread across multiple systems. Today, a three-person team runs a full production AI stack from a single place, and the whole team can triage issues independently.
The bigger shift is what that visibility unlocks. Using Logfire, Overjoy caught a bug where one agent's usage spiked to 20x normal, silently repeating the same call. Without cost visibility, they would have burned through budget before noticing. A broken sales demo agent got diagnosed, experimentally fixed across multiple models and prompting strategies, and shipped to production in a 35-minute Uber ride.
Ishaan describes the Pydantic stack simply: "It feels like a secret our team has."
Key takeaways
- Consolidate before you scale. Fragmented observability compounds as features grow. A single platform covering the full stack — general tracing, AI observability, and eval workflows — is worth the setup cost.
- Observability data is more than a debugging resource. Logfire traces feed directly into prompt iteration and eval workflows. The same data that surfaces outages can drive autonomous quality improvement.
- Visibility unblocks bottlenecks. When any engineer can independently debug customer issues, it removes a bottleneck that silently slows every growing team. Standardizing on Pydantic — with consistent interfaces, self-documenting tools, and type-safe outputs — is what makes it possible for a lean team to ship production-grade AI features fast.
- The Logfire MCP server changes how you interact with your stack. When an AI coding agent can query your traces directly via SQL, observability stops being a dashboard you open and becomes context you can act on.
Interested in how Pydantic AI and Pydantic Logfire work together in production? Explore the docs or get started with Logfire.
