Your support agent fires three tools on a normal run: look up the order, check the policy, draft the reply. Your dashboard says the average is 3.1. Everything looks healthy.
Then the monthly bill arrives higher than it should be, and you go looking. Somewhere in the last ten thousand runs, one request hit a retry loop and fired forty tools before it gave up. It cost twelve dollars. It didn't error, so nothing paged you, and the average absorbed it without a ripple. There are probably a dozen more like it this month, and the mean will never tell you.
What's new
Two views, both drawn from the gen_ai.* spans your agents already emit.
The Agents view is a curated inventory of agent runs discovered across OpenTelemetry GenAI, OpenInference, OpenLLMetry, and framework-specific conventions: run count, average duration, a usage sparkline, and last-seen. Logfire adds model, token, cost, tool, and message details wherever the framework records them. Open an agent to see its runs and exceptions over time, plus turns per run and tool-calling turns per run when those signals are present, each shown as average and p90.
Each detected run opens into a Summary and the full Trace, with dedicated Model, Tool Calls, Messages, and Tools views populated from the telemetry available. When tool definitions and calls are recorded, the Tools tab reconstructs what the agent was allowed to do and what it actually did on that run. When a run goes strange, "what could it even do here" is usually the first question, and now it is a tab, not an archaeology project.
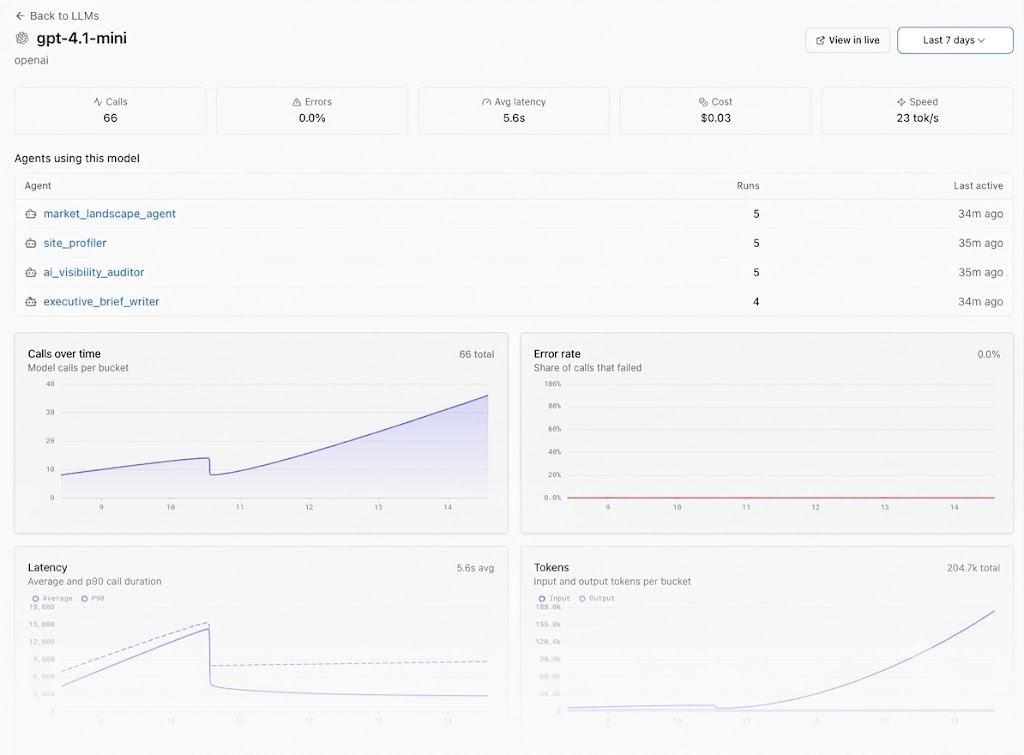
The LLMs view is the inventory from the model's side: one row per recognized provider and model, with calls, errors, latency, throughput (output tokens per second), token usage, cost coverage, truncation rate, and tool-call rate. Cost comes from Pydantic's open-source genai-prices dataset when the span contains a supported model and token counts. Open a model to see its trends, the agents Logfire can associate with it, and its recent calls, each one a click from the trace.
Why this matters
An agent breaks in shapes a service doesn't, and these two views are built around three of them.
The shape of a run is non-deterministic, so summary statistics lie by design. A p99 over a hundred runs hides what the p99 over a hundred thousand will tell you. The avg-vs-p90 charts exist because the runaway run, the one that fired forty tools where the median fired three, is invisible in the mean and obvious in the tail. You should not have to write a dashboard to see the thing that's costing you the most.
The cost is variable per request, measured in dollars, on prices that move weekly. Logfire calculates cost from recorded model and token fields using an open dataset, and reports its pricing coverage so the number is auditable.
The dependency moves under you. A provider deprecates a model, throttles it, or swaps a snapshot on their schedule, and your latency doubles with no change on your side. The LLMs view is where that shows up first: per-model latency and throughput, side by side, so a regression has a name before it has a war room.
The model call, agent runtime, and the services around them can share one trace ID. Logfire reads OpenTelemetry GenAI, OpenInference, OpenLLMetry, and framework-specific attributes to turn that trace into purpose-built LLMs and Agents views. Every span the integration emits remains available in Live and Explore, even when it does not yet populate every curated field. The framework coverage guide shows the experience for each setup.
It's an inventory before it's a dashboard, and that's deliberate: past a handful of agents you stop watching them one at a time. Sort the fleet by cost, errors, or last-seen, and the sick animal is the top row. The runaway you're hunting, the agent doing something your evals never thought to describe, lives in the tail of a distribution you only see once you're looking at the whole herd.
Getting started
Both views are available in every Logfire project. They populate from recognized gen_ai.*, OpenInference, OpenLLMetry, and framework-specific spans within a minute or two. Follow the integration guide for your framework, and use Live or Explore for any telemetry that is not yet promoted into a curated view.
In our support-agent scenario, the path is short. Sort the Agents inventory by cost, open the agent, and the tool-calling-turns p90 chart is three times the average. Click the tallest bar into the run, open the Tools tab, and the retry loop is right there: a tool with no stop condition, called until the turn limit. One guard, shipped, and the tail comes back down.
Not using Logfire yet? Get started. The free tier includes 10 million spans a month, our AI gateway, and so much more.