Instrument the libraries around an agent to record its model calls, tool calls, HTTP requests and database queries in one trace, then query the result with SQL. Free for 10 million spans a month.
A Logfire trace of one agent request. The API loads the conversation, runs an agent that calls the model, runs two tools in parallel and calls the model again, then writes the reply and charges through a billing worker. The GitHub call inside the first tool raises.
frontend 11 POST /api/ask200Σ↗1.4K↙183 logfire 3.99s
api SELECT conversations logfire 64.1ms
api 7 agent runΣ↗1.4K↙183 pydantic-ai logfire 3.42s
api chat gpt-5↗196↙96 pydantic-ai logfire 805ms
api 4 running 2 tools pydantic-ai logfire 1.91s
api 1 fetch_issue logfire 395ms
api GET api.github.comexception logfire 352ms
api 1 search_docs logfire 1.46s
api SELECT documents logfire 1.3s
api chat gpt-5↗1.2K↙87 pydantic-ai logfire 651ms
api INSERT messages logfire 50.8ms
billing-worker POST api.stripe.com200 logfire 285ms
Trusted by teams building production software and AI
The difference
Problems in AI applications hide in the seams
The trace above separates two failures that look the same to a user waiting on an answer. fetch_issue contains a failed GitHub API
request, while search_docs spends most of its time in SELECT documents. The model call alone cannot explain either
one.
Instrument the agent framework, HTTP client and database driver, and propagate trace context between participating services. Logfire then
records the request, model, tool, external API and database work as one trace. When an agent stalls because a dependency is
degraded, the connection is visible instead of inferred from timestamps in separate products.
Try it on your stack
Trace one real agent run
Start free with 10 million spans, logs, and metrics each month. No credit card required.
Agent (or LLM) observability is the practice of recording what an AI application actually did in production, and being able to ask questions
about it afterwards. Traditional monitoring tells you a request returned 200 in 900ms. LLM observability tells you the agent called
the wrong tool twice, retried, spent 14,000 tokens and produced an answer nobody checked.
The unit that matters is the run, not the call. A single run is usually a tree: several model calls, tool invocations,
retrieval steps, and sometimes handoffs between agents across more than one service. Recording that tree with the causal chain intact is
what separates an answerable question from a pile of individual requests.
Setup
One line per library
Each instrument_* call is one line, and they compose: instrumenting the agent framework, the HTTP client and the database driver
is what produces a single trace rather than three disconnected ones. The same OpenTelemetry foundation works across frameworks; Logfire recognizes
several common AI conventions to add purpose-built views. The framework coverage guide shows the experience for each setup.
Python
import logfire
from pydantic_ai import Agent

logfire.configure()
logfire.instrument_pydantic_ai()
logfire.instrument_httpx()
logfire.instrument_asyncpg()

agent = Agent('openai:gpt-5-mini')
result = agent.run_sync('Why did checkout slow down?')
What you get
Every run, end to end
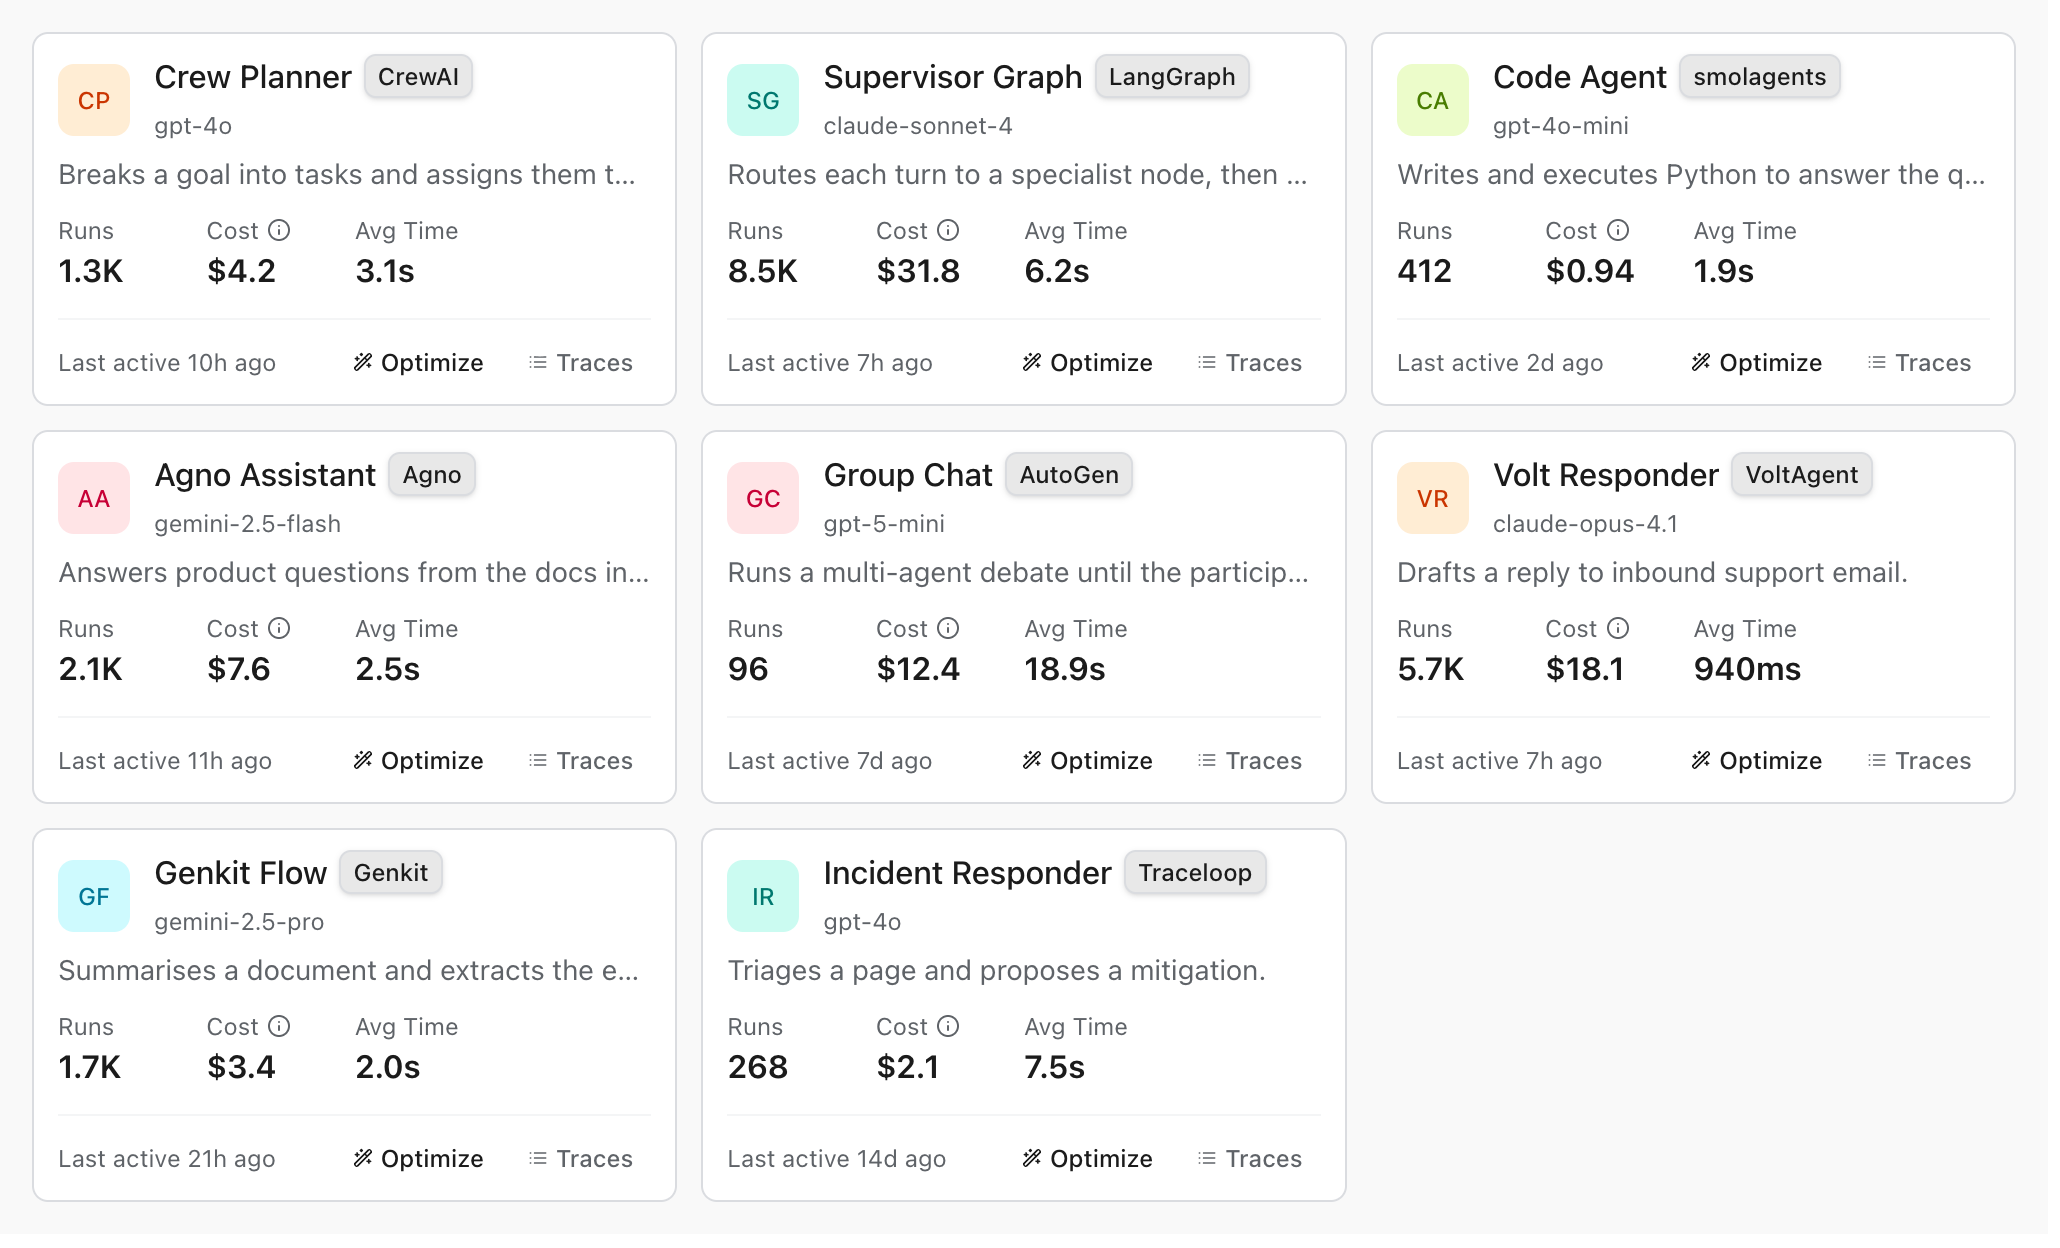
A single inventory for agents detected across several telemetry conventions. Logfire adds model, token, cost, tool, and message details wherever the framework records them.
The run, not the request
An agent run is a tree: model calls, tool invocations, retrieval steps, and handoffs to other agents. Logfire preserves the structure emitted by the framework in one trace, so you can see which tool was called, what it returned, and which step took the time. It detects agent roots from OpenTelemetry GenAI, OpenInference, OpenLLMetry, and several framework-specific conventions.
Tokens and cost per model, per provider
Logfire groups recorded model and token data by model and provider alongside latency, error rate, output tokens per second, cache reads, and tool-call rate. OpenAI, Anthropic, and Pydantic AI record cost on supported spans; other model calls can be priced from token counts in the UI. The models view reports pricing coverage, and connected agent traces roll those values up per agent.
The conversation, rendered
Open supported model spans and read the exchange as a conversation: system, user, assistant and tool messages in order, with tool names, arguments, payloads and token badges. Pydantic AI and selected native OpenTelemetry GenAI integrations provide the richest view. The fields shown depend on what the instrumentation emits; OpenInference and other bridges may omit message, tool or cost details.
Prompts you can change without a deploy
Keep prompts out of your code with versioned, labeled templates the SDK fetches at runtime. Roll a new prompt out to a percentage of traffic, target it at a subset of users, and roll it back without shipping. Every resolution is recorded, so you can tell which version produced which run.
Evals in the same place as the traces
Turn a production trace into a test case, run experiments from code with pydantic-evals, and compare a candidate against a baseline case by case. Evaluation results are emitted as OpenTelemetry events and are queryable alongside production traces.
OpenTelemetry-native, so nothing is trapped
Logfire speaks OpenTelemetry natively. Instrument with our SDK or with plain OTel, send from any language that has an OTel SDK, and export the same data elsewhere whenever you want. Your instrumentation is an asset you own rather than something rented from a vendor.
At a glance
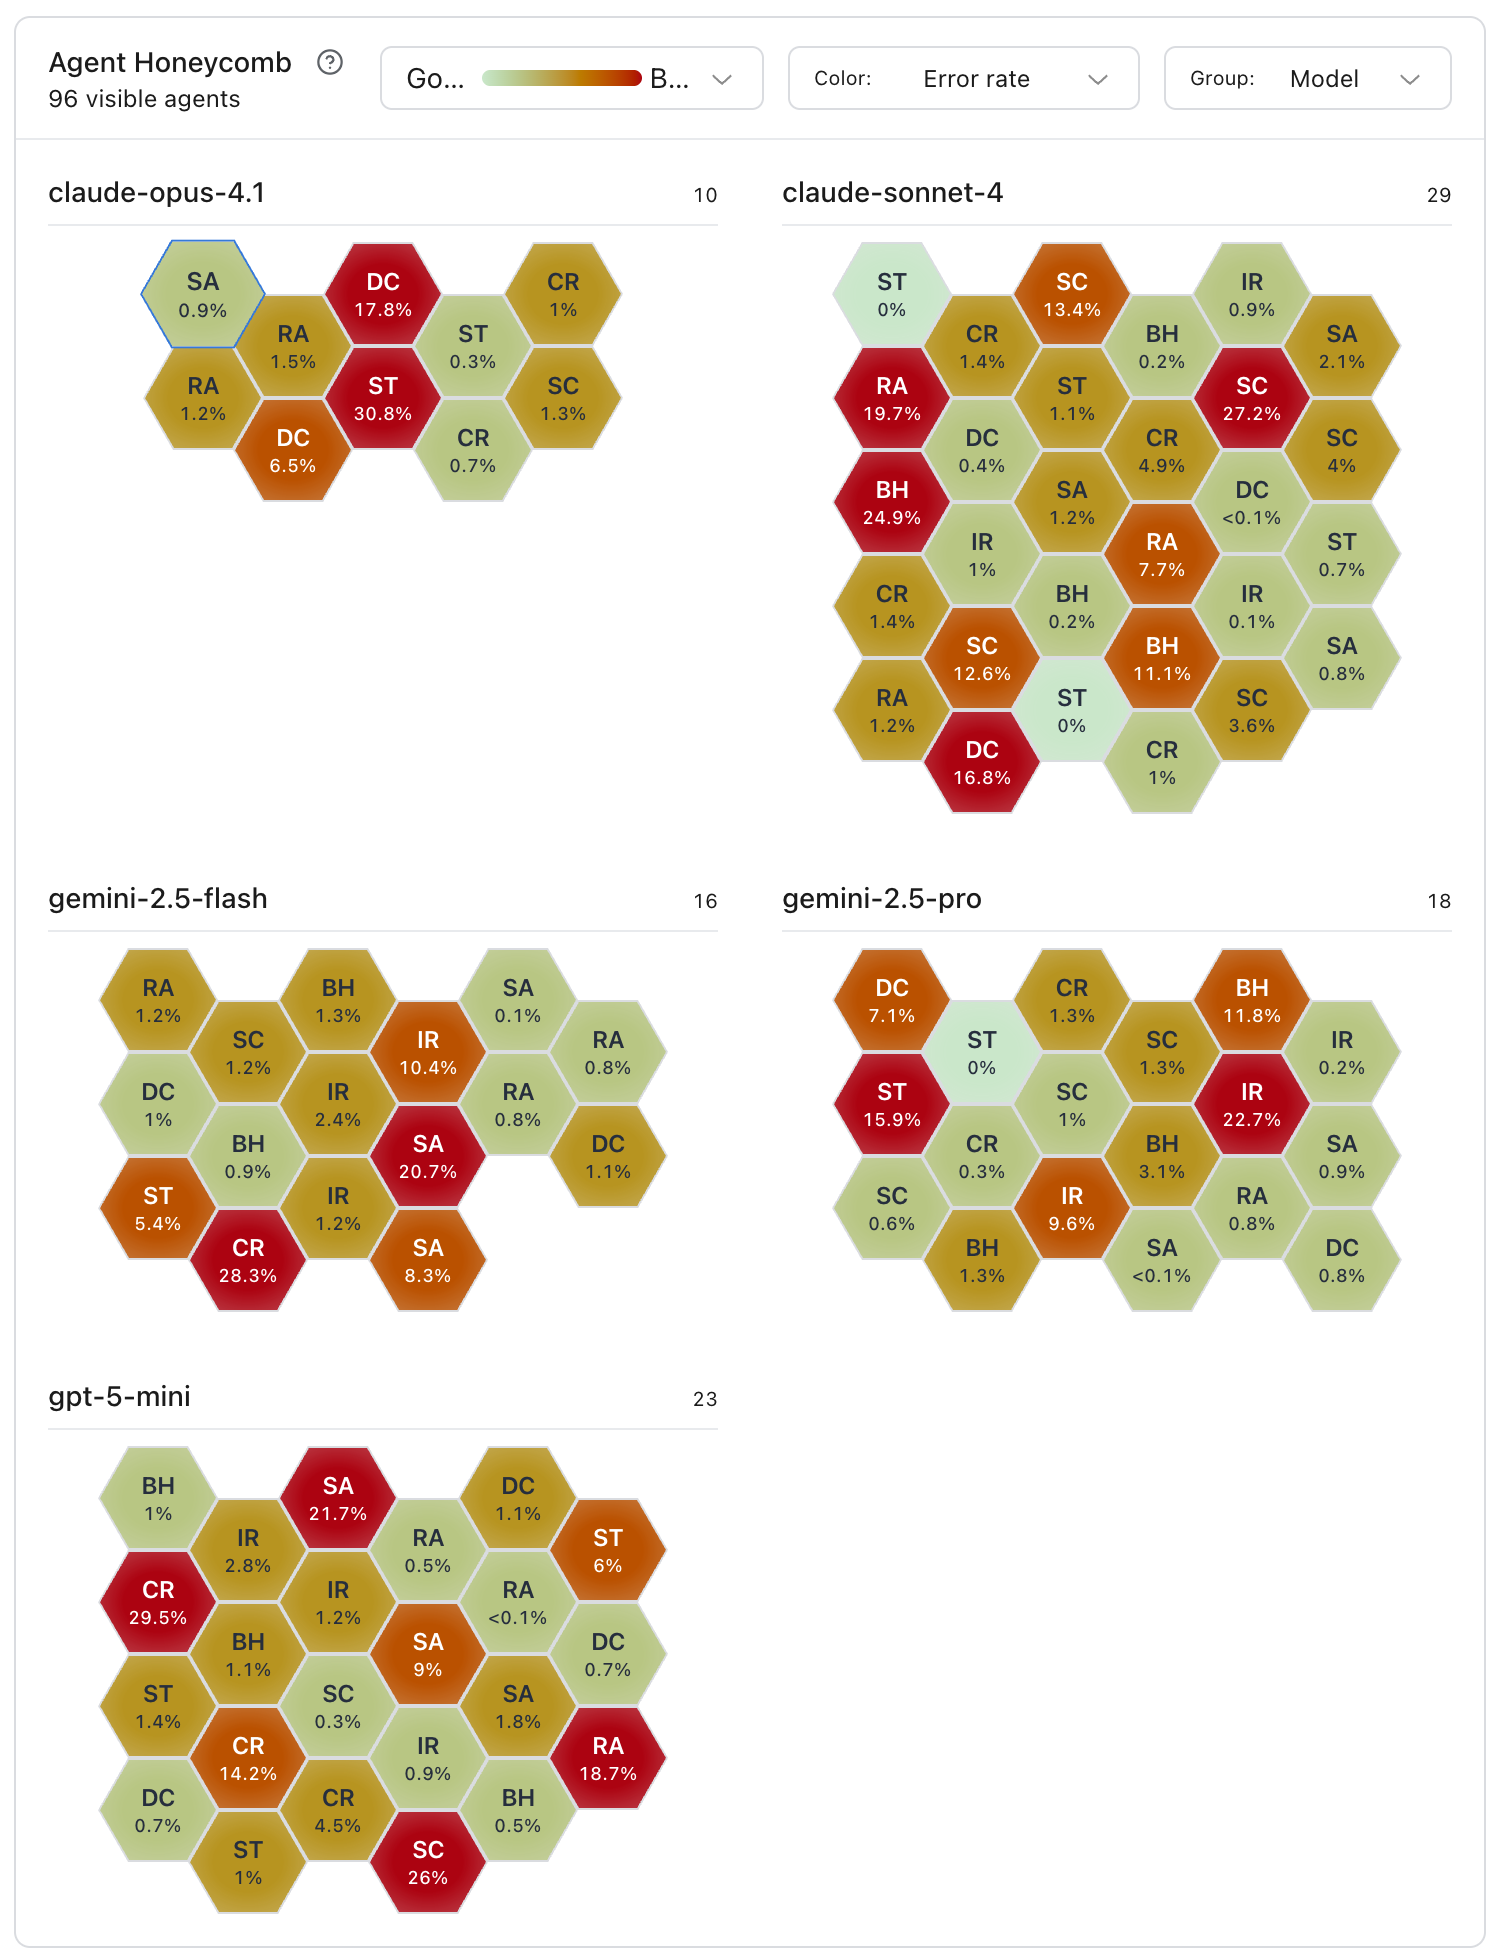
Ninety-six agents, one screen
A list is fine for eight agents and useless for a hundred. The honeycomb puts the whole fleet on one screen, one cell per agent, colored by
the metric you are worried about and grouped by the dimension you suspect, here error rate, grouped by model.
Grouping by model is the version that pays: the red cells are not spread evenly, so 'which model is failing my agents' is answered by looking rather than by querying. Change the grouping to provider, or the color to cost or latency, and it answers a different question.
Models and providers
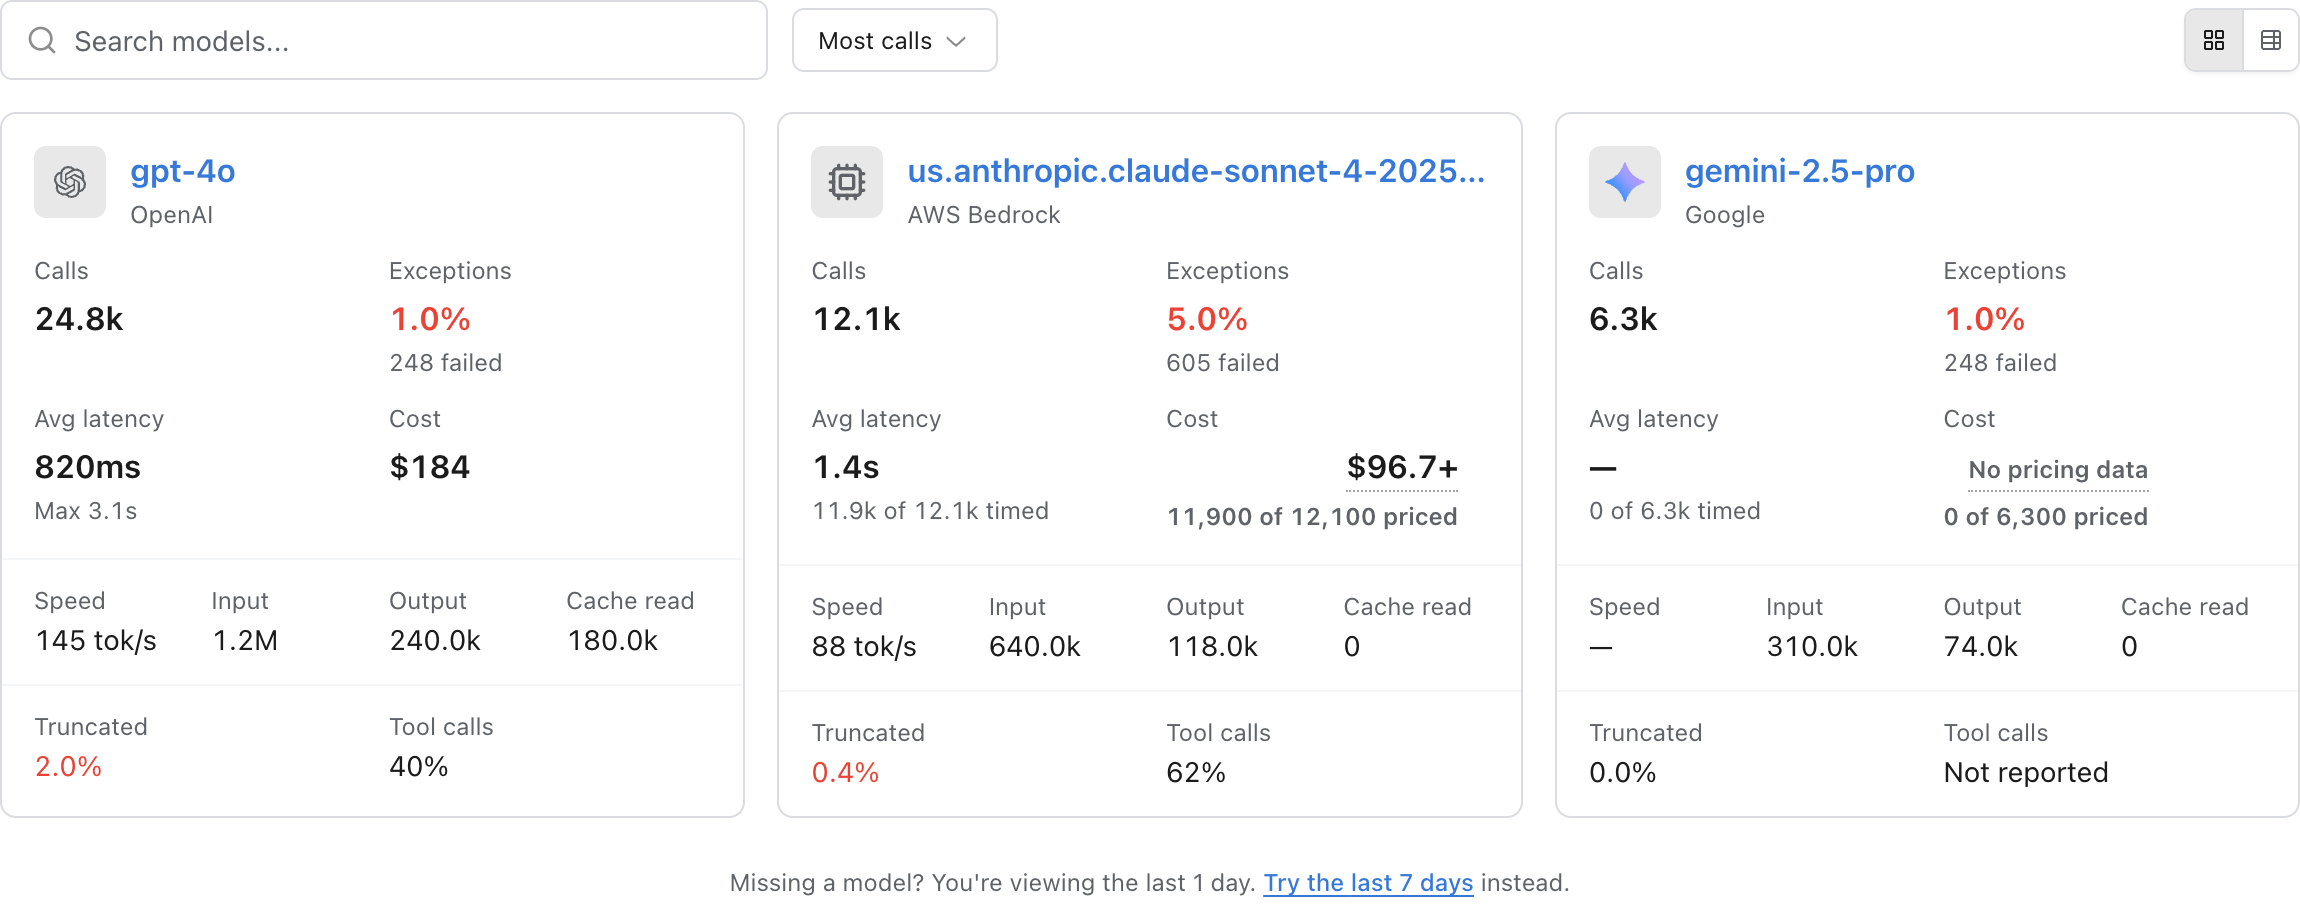
What you are spending it on, and whether it is up
Model calls using standard GenAI and OpenInference conventions are discovered directly from their spans, with no model list to maintain.
Calls, exceptions, latency, tokens and cost per model, derived from your traces, with the gaps left visible rather than filled in. Gemini reports no pricing data and no latency, because none of those 6,300 calls were priced or timed, which is a different statement from zero.
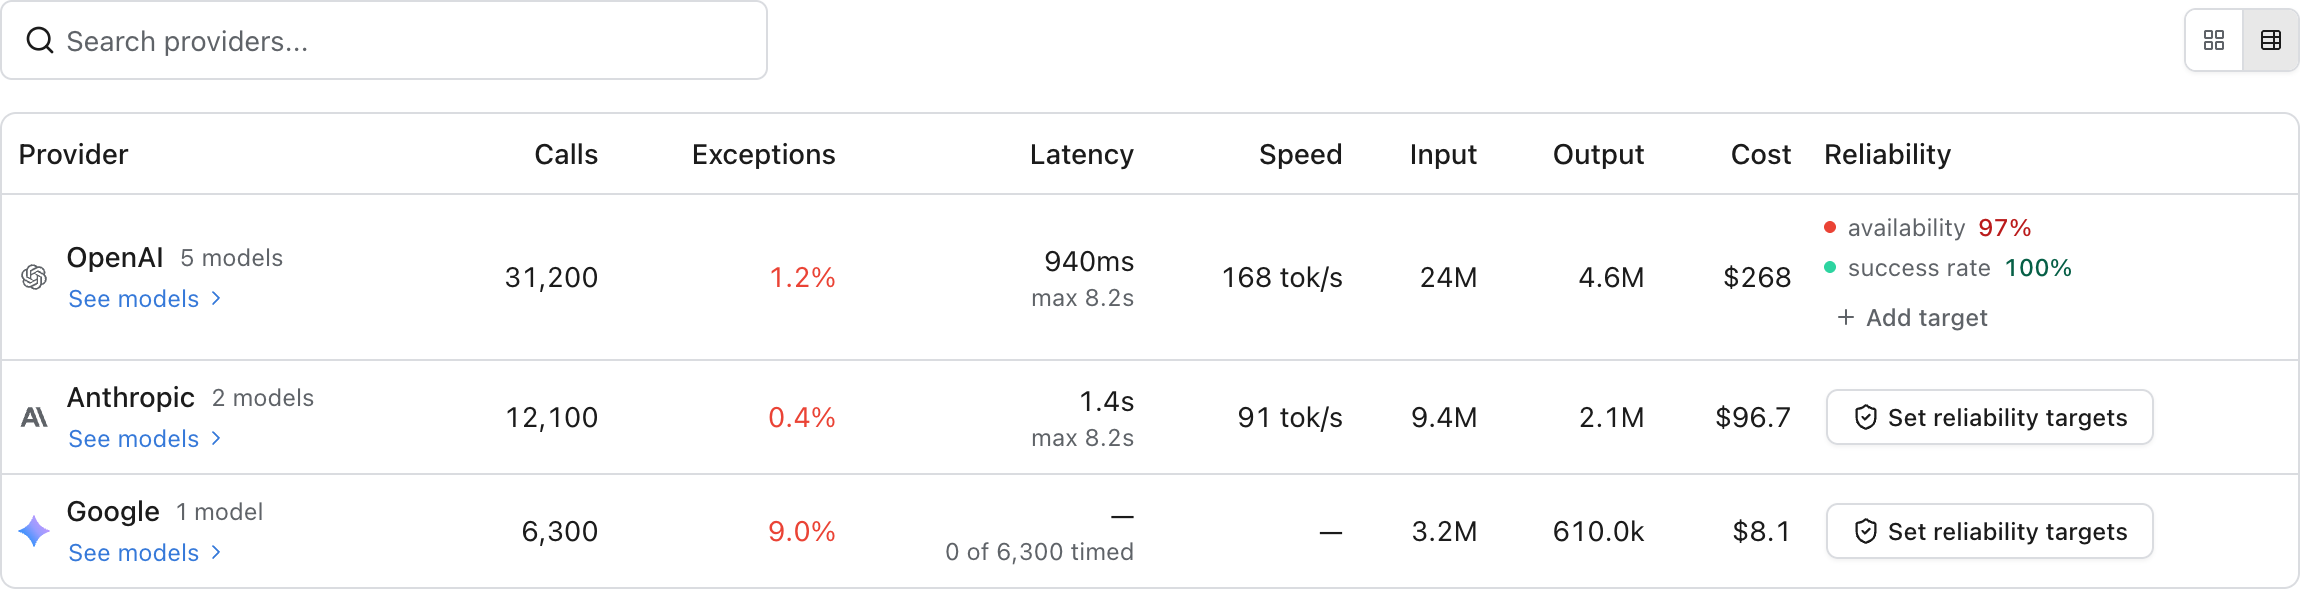
The same view rolls up by provider, and this is where it stops being an inventory and starts being an SLO. Set a target on a provider and it
reports against it, so "is OpenAI having a bad day" is a number you already have rather than a status page you go and read.
OpenAI is missing its availability target, 97% against 99%, and the chip is red before anyone opens a dashboard. Providers with no target yet get a one-click way to set one, so the SLO lives next to the spend rather than in a separate tool.
Try it on your stack
See Logfire on your own telemetry
Start free with 10 million spans, logs, and metrics each month. No credit card required.
The questions you want to ask about an agent are aggregations over attributes nobody planned for: cost per customer this week, p95 latency
by model, which tool call precedes a retry. Logfire uses SQL in PostgreSQL syntax, so those are a GROUP BY over the same table the traces
are in, rather than a dialect with a special function for each shape of question.
That matters more once an agent is doing the asking. Point a coding assistant at the Logfire MCP server and it can answer "which prompt version is burning the tokens" itself, because writing that query needs no dialect it has only seen a handful
of examples of.
SQL
select
attributes->>'gen_ai.request.model'as model,
count(*) as calls,
avg(duration) as avg_seconds
from records
where attributes->>'gen_ai.request.model'isnot nulland start_timestamp > now() -interval'7 days'groupby model
orderby avg_seconds desc;
The store
FusionFire
FusionFire is Logfire's store for wide, high-cardinality agent telemetry. A single span can carry a conversation, tool payloads,
token counts, cost, and the attributes you will filter or group by later.
FusionFire is built to scan that shape and group by fields such as model name or customer ID even when nobody indexed them in advance. The
APM page has the engine detail if you want it.
The query surface is PostgreSQL-compatible SQL over the same table that stores the traces, on every plan. Here is how that performs for one
team running agents in production:
“
We migrated from LangSmith to Logfire and the time it took to query our agent traces went down by 96.2%.
Andrew Pignanelli, Founder and CEO, General Intelligence CompanyRead the case study
In production
Teams running agents on Logfire
“
Having it built primarily off a first-class observability platform is the big thing that sold me as we're not running just LLM agents. We want to see observability on your API endpoints and all that other stuff too.
How is agent observability different from LLM observability?
LLM observability covers a single model call: the prompt, the response, tokens and cost. Agent observability covers a whole run, which is usually a tree: several model calls, tool invocations, retrieval steps and handoffs between agents, often across more than one service. The unit you care about is the run, not the call, so the trace has to keep the causal chain intact rather than showing you a list of individual requests.
Can I see my database queries and my LLM calls in one trace?
Yes. Instrument the agent framework and the libraries around it, then propagate trace context between participating services. Logfire can show the FastAPI request, Postgres query, vector search, tool call and model call in one trace. When retrieval makes an agent run slow, the cause is visible in the same waterfall rather than inferred across separate products.
Which agent frameworks does Logfire support?
Logfire accepts OpenTelemetry from any framework and detects structured agent runs from OpenTelemetry GenAI, OpenInference, OpenLLMetry, and several framework-specific conventions. That includes Pydantic AI, LangGraph, OpenAI Agents SDK, CrewAI, smolagents, Agno, Google ADK, Strands, Semantic Kernel, Mastra, Vercel AI SDK, Genkit, VoltAgent, and Traceloop. The framework coverage guide shows which additional model, token, cost, tool, and message fields each integration contributes to the curated views.
Does Logfire support OpenTelemetry?
Logfire is built on OpenTelemetry rather than wrapping it. Any language with an OTel SDK can send data, standard OTel instrumentation works unchanged, and you can export the same telemetry to another backend. There is no proprietary agent and no proprietary wire format, so your instrumentation stays portable.
Will tracing my agents add latency?
Spans are batched and exported asynchronously on a background thread, so instrumentation does not sit in the request path. For high-volume services you can sample: head sampling decides before work happens, tail sampling decides after, so you can keep every failed or slow agent run while sampling the routine ones.
How much does it cost to trace an AI application?
Personal includes 10 million spans, logs and metrics per month and pauses ingestion at the limit. On Team and Growth, usage beyond the included 10 million records costs $2 per million. Logfire does not add a separate per-score fee for evaluation results.
See what your agents are actually doing
Get started with 10 million free spans, logs, and metrics per month. No credit card required.