

Drafts touch nothing
Save as many drafts as you like. A Collector or application only changes when someone publishes a version, so a half-finished edit never reaches production because a tab was left open.
Change what your OpenTelemetry Collectors and applications collect, sample and redact from one place, without SSH sessions or redeploys. Hosts, Kubernetes clusters and instrumented services connect over OpAMP, the open protocol for managing telemetry agents.

Trusted by teams building production software and AI




Every machine runs a Collector and every service runs an SDK, and each has a configuration that decides what is collected, what is dropped and where it goes. Fleet management moves that configuration out of a thousand files and into one place, where you can change it, roll it out, and see which agents are actually running it.
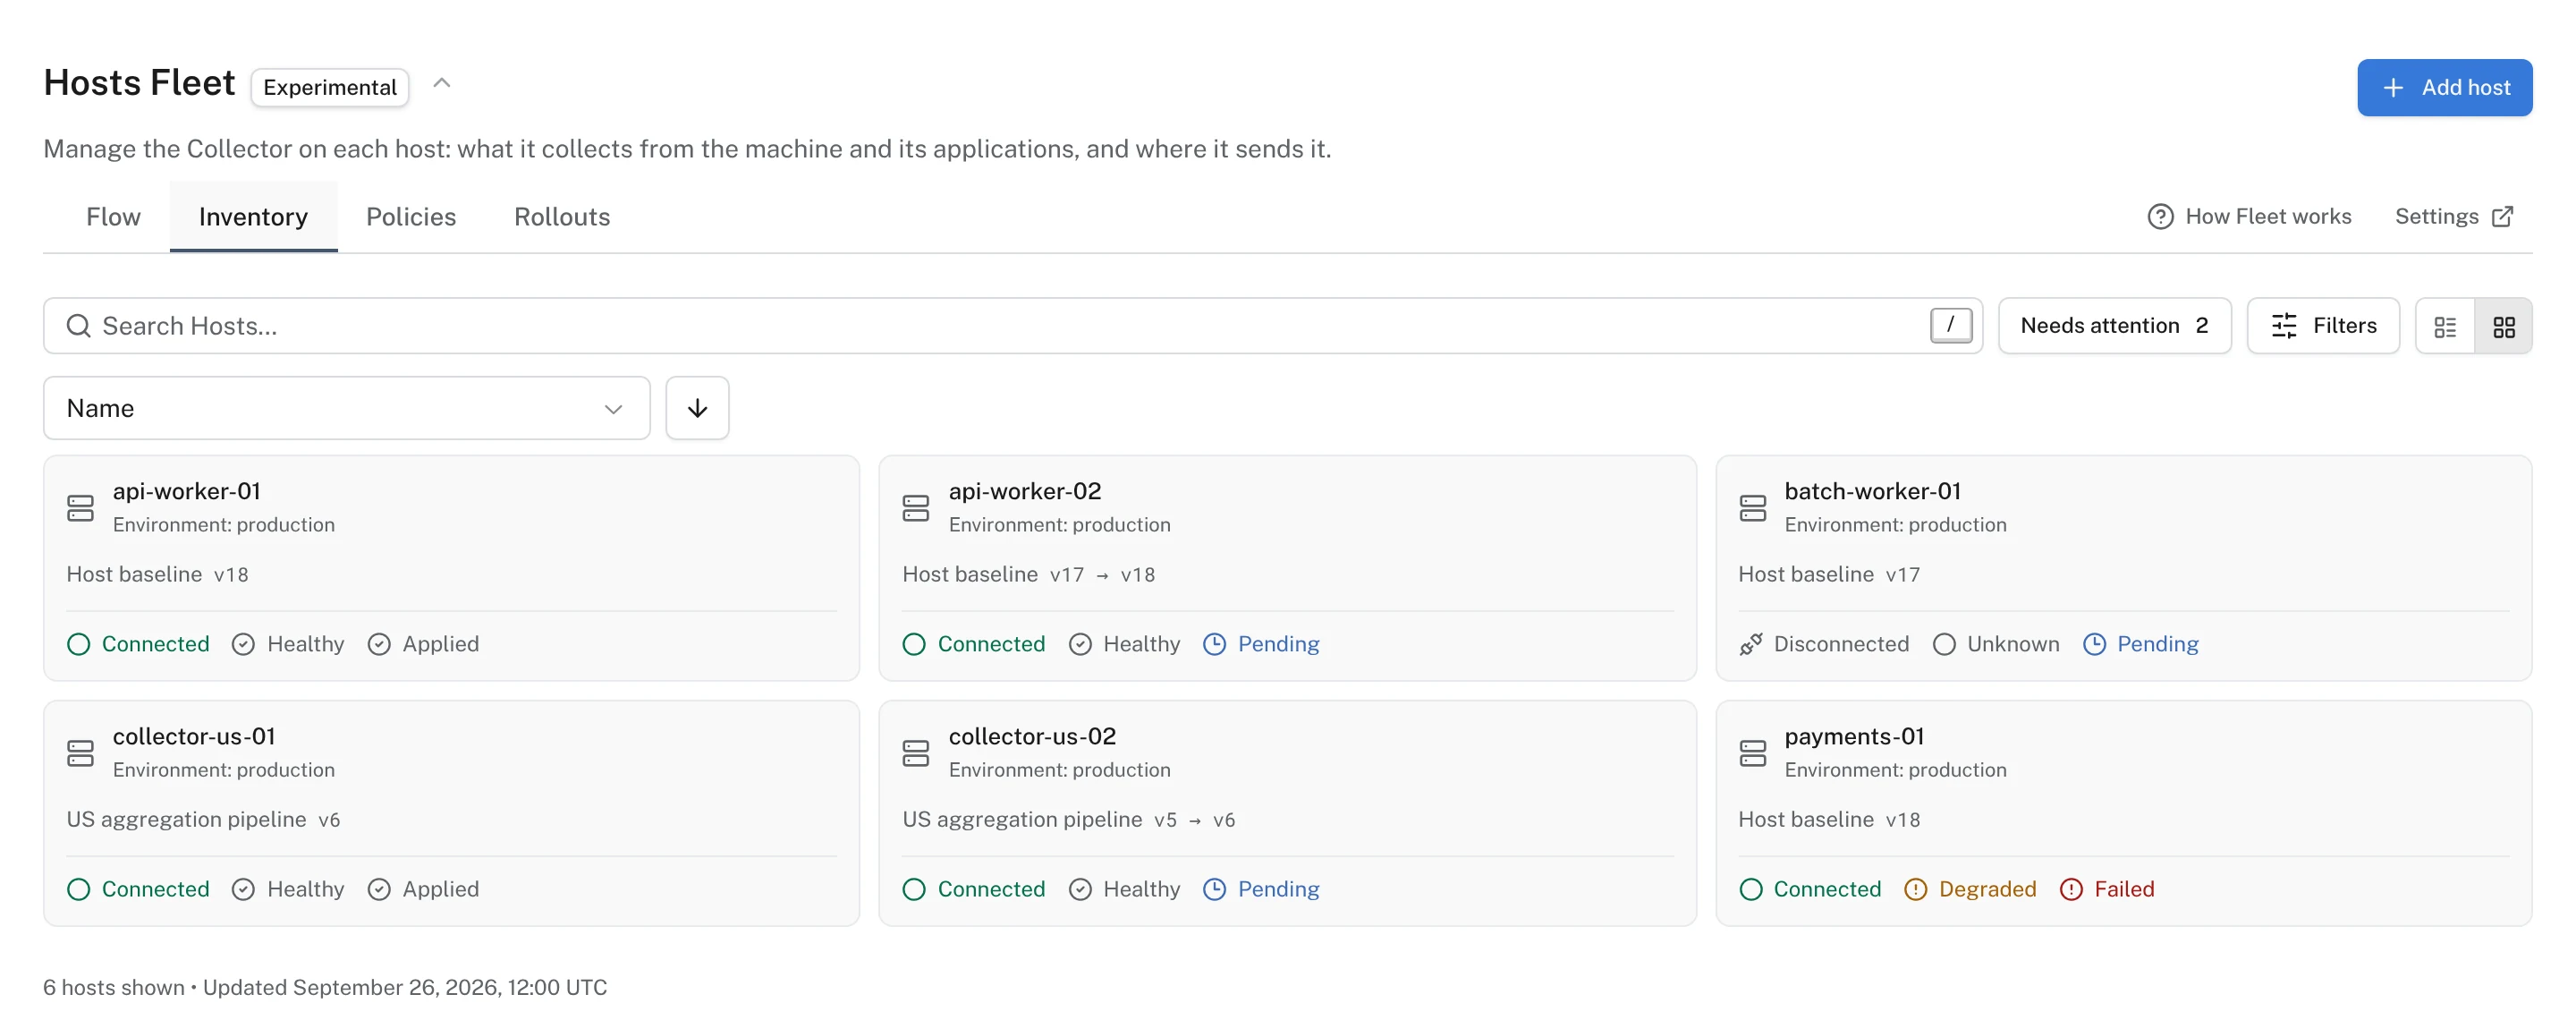
In Logfire, each agent keeps a connection open over OpAMP, reports its health and effective configuration, and applies the policy you publish. Nothing proprietary sits on the hosts: the Collectors are upstream OpenTelemetry builds.
Python, Node.js, Go, Java and .NET services connect with a small OpAMP client beside their OpenTelemetry SDK. An application policy changes sampling, exports, log level and redaction inside the running process.
A standard OpenTelemetry Collector build, run by an OpAMP Supervisor on Linux, macOS or Windows. Fleet owns its whole configuration: what it collects from the machine, what the local apps send it, and where it all goes.
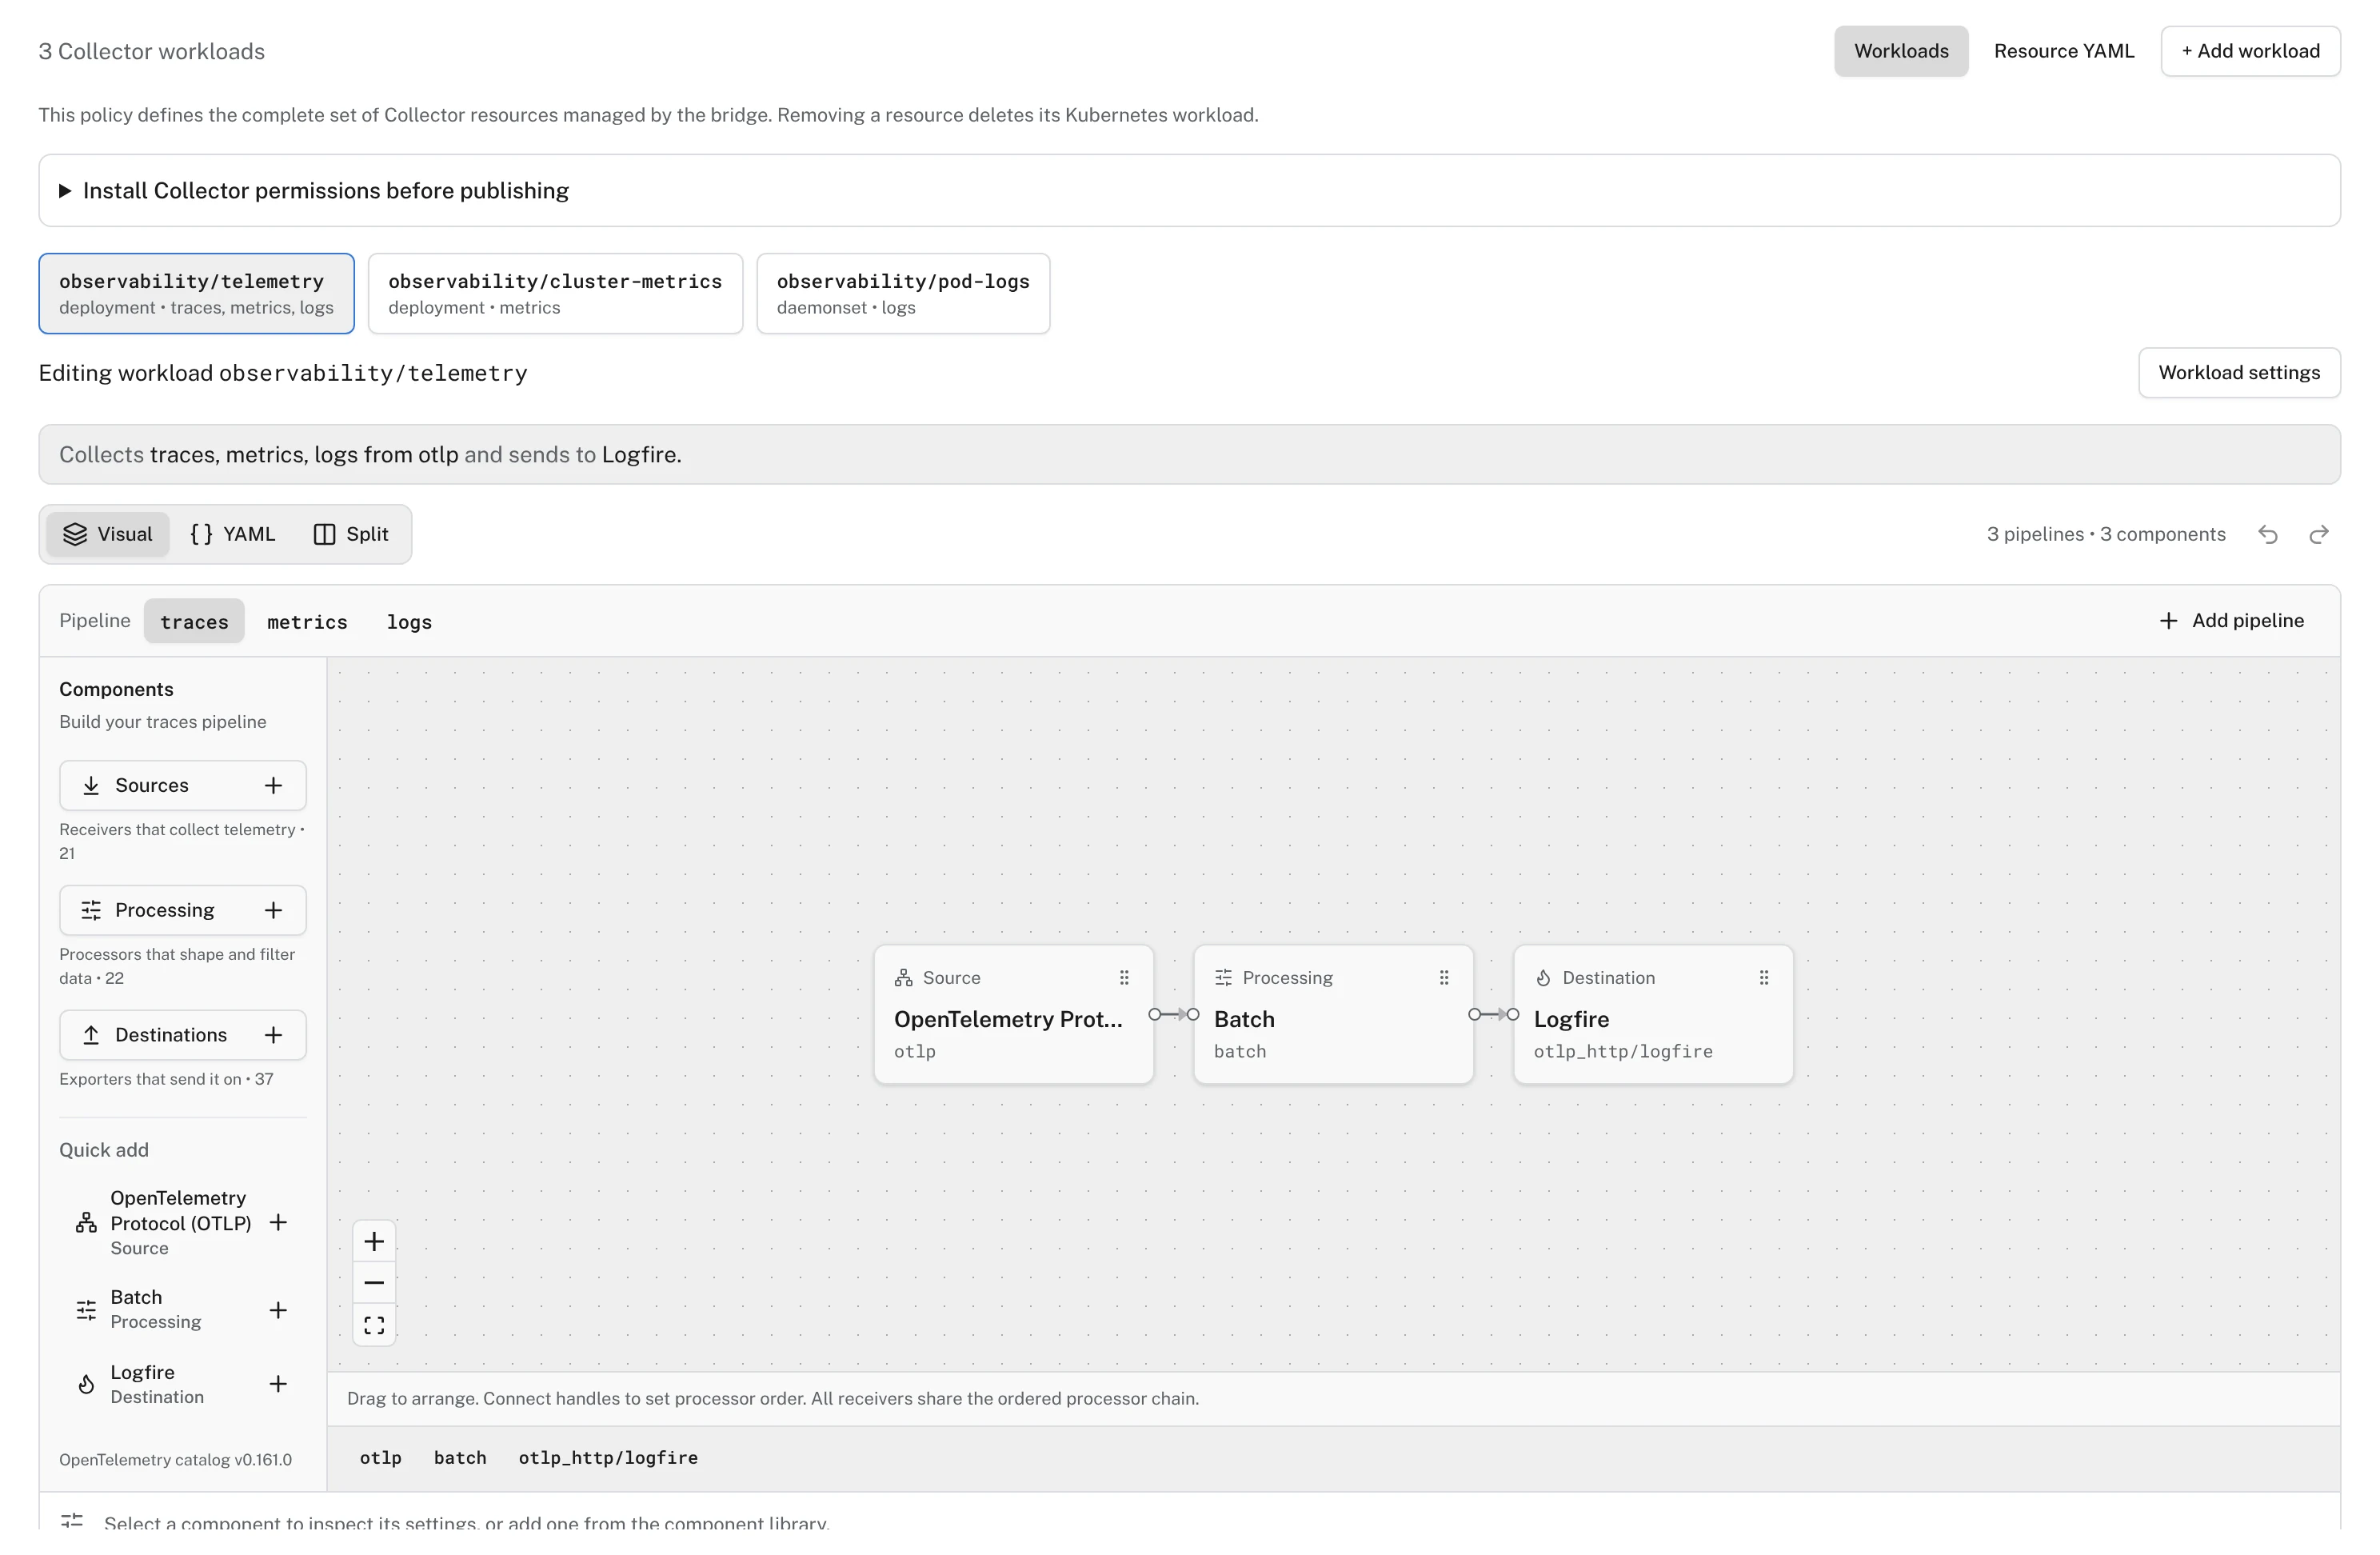
The OpenTelemetry Operator's OpAMP bridge connects a cluster. A Kubernetes policy describes the Collector workloads (deployments and daemonsets) and the Operator creates, updates or removes them to match.
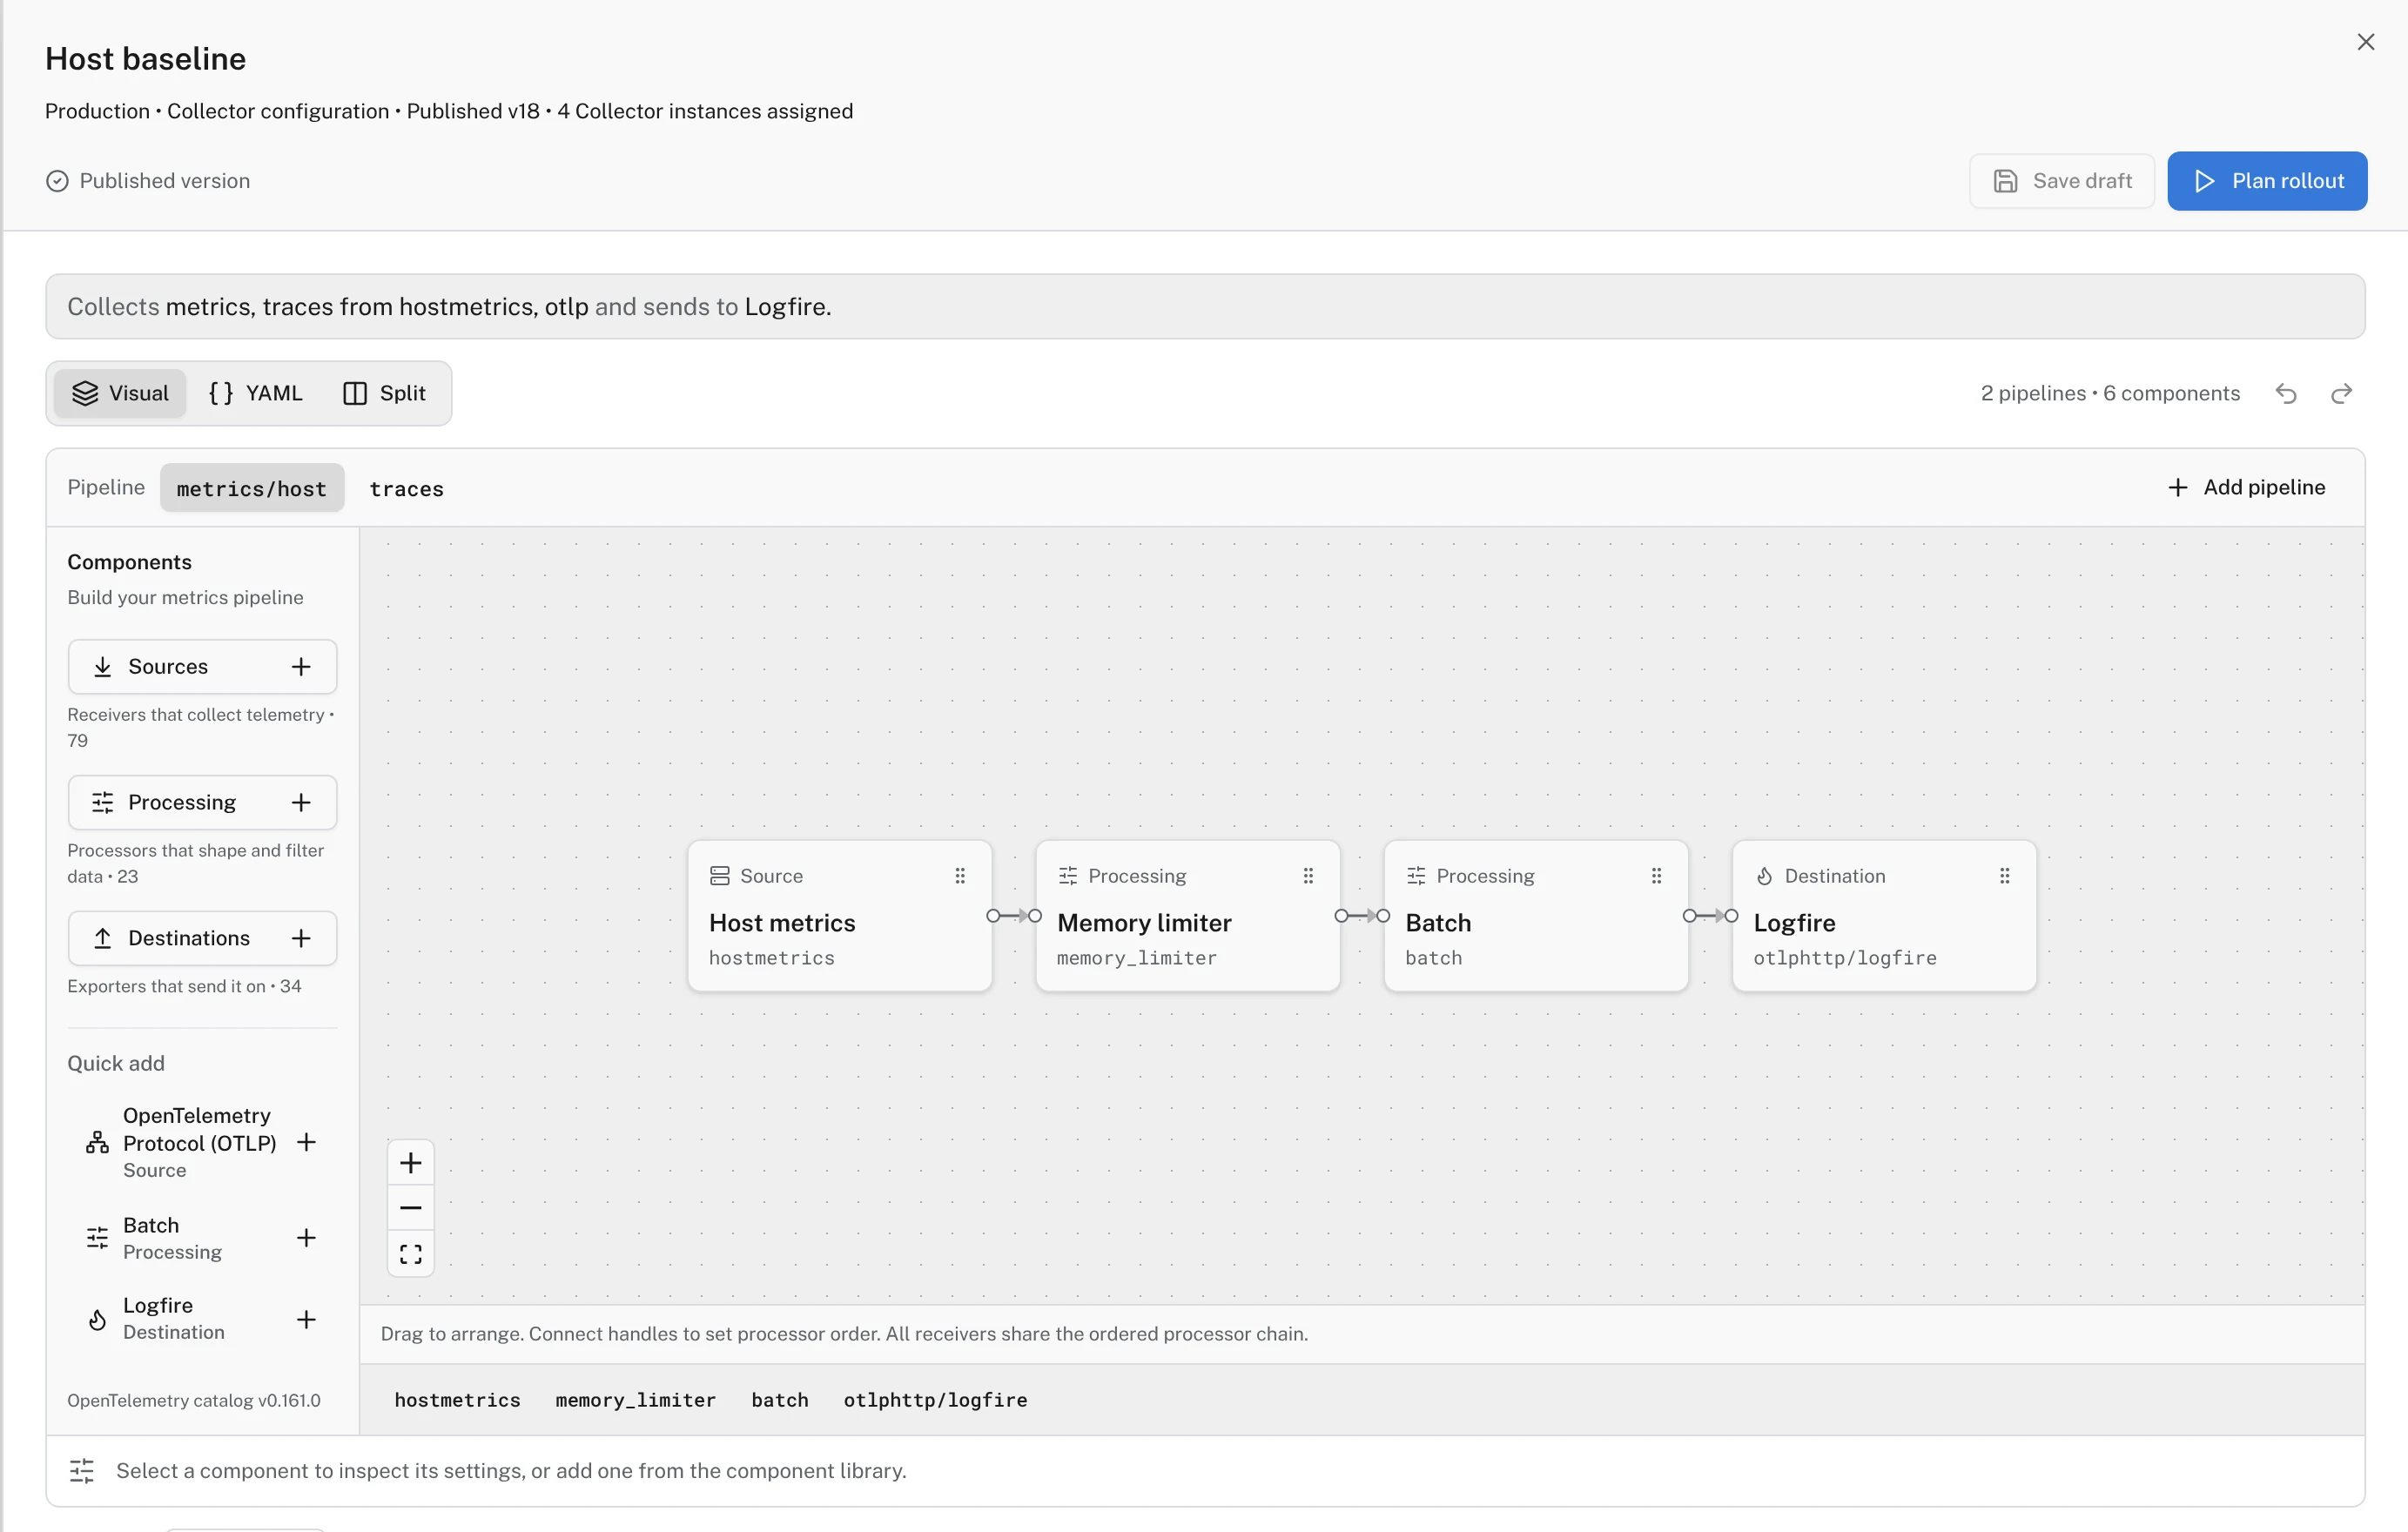
A Collector policy is a Collector configuration. Edit it as a pipeline of sources, processing and destinations, as YAML, or both at once in Split view: they are the same document, and comments survive the round trip.
Start free, then ask us to turn on Fleet Management for your organization.
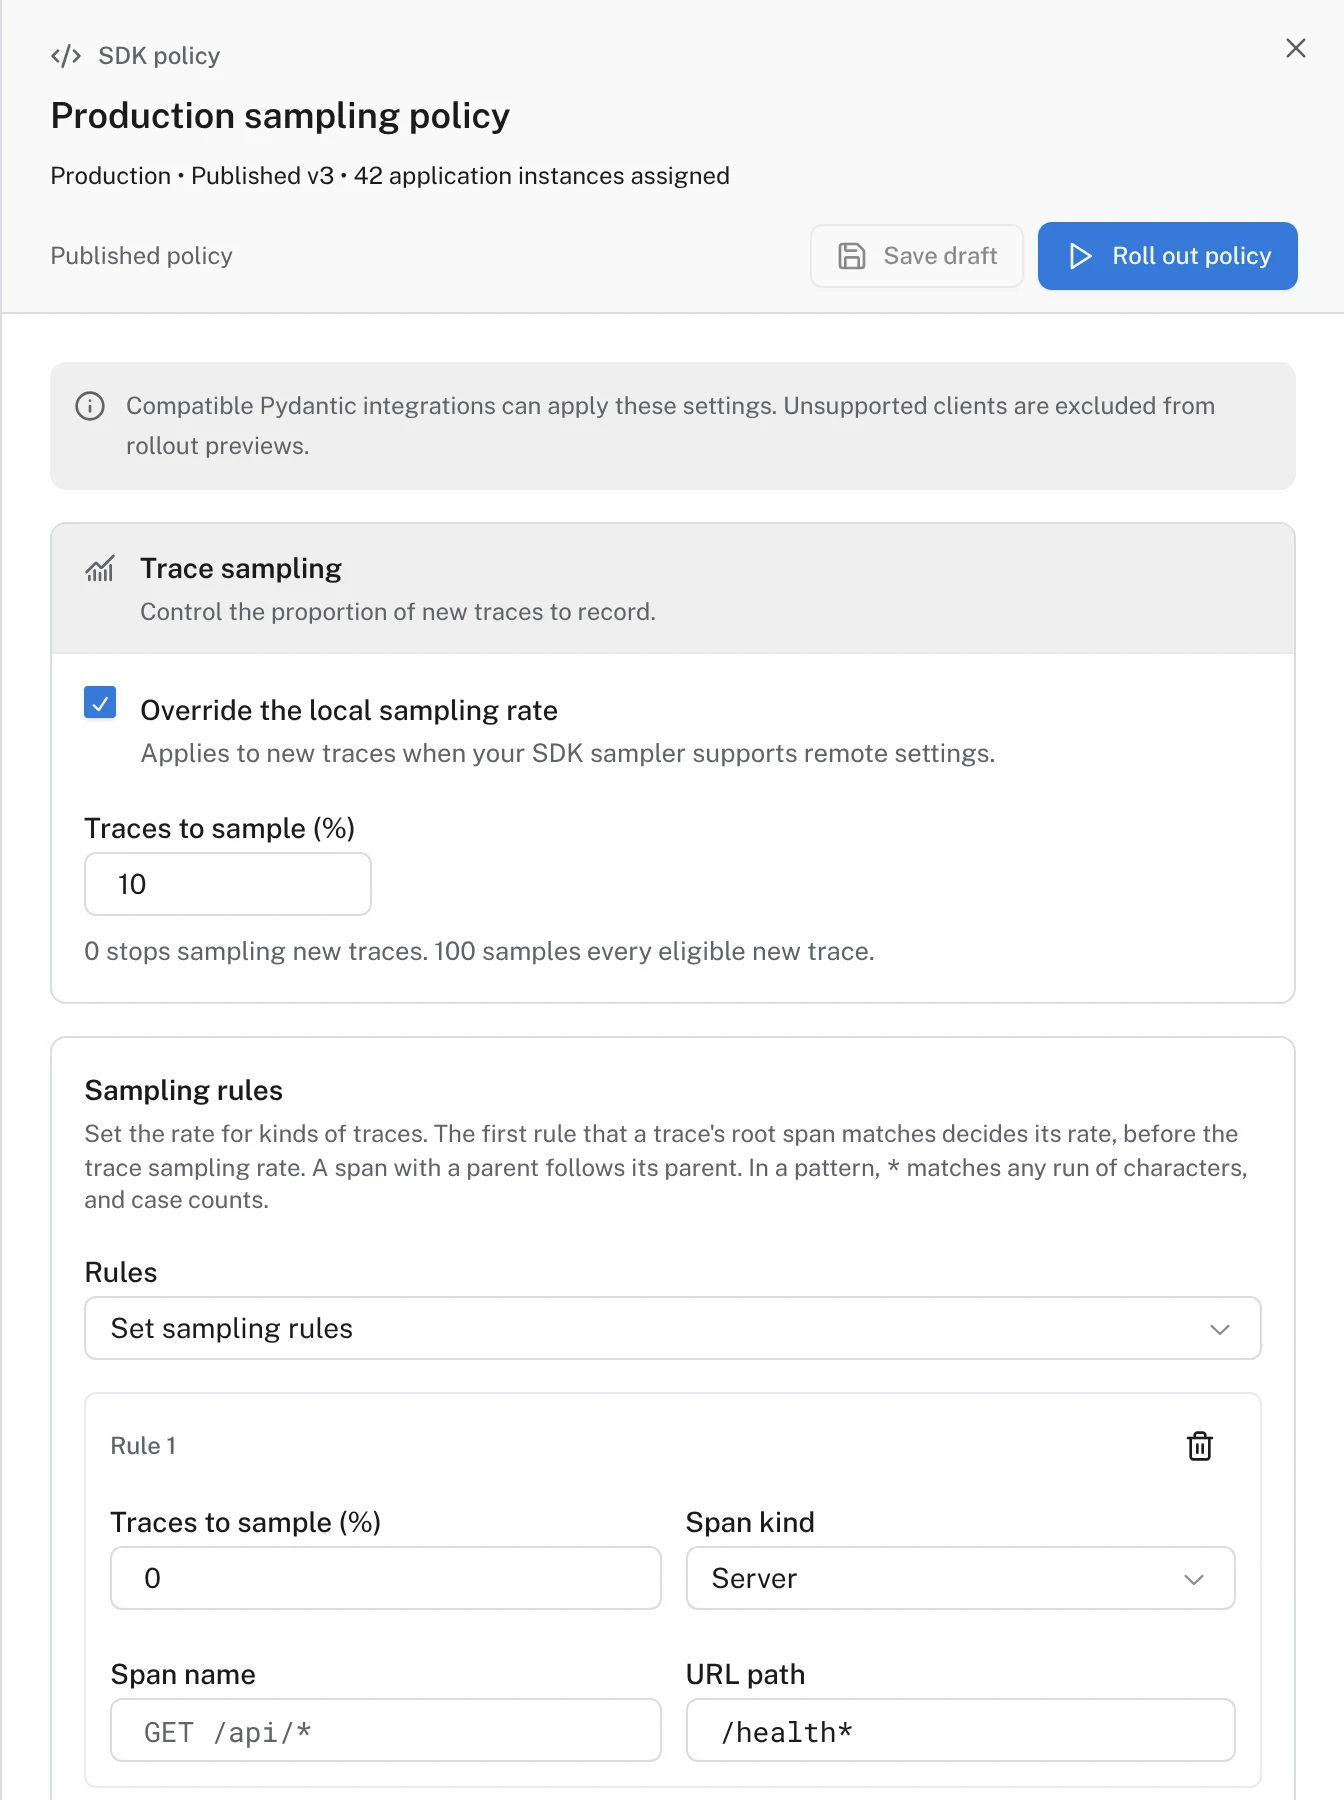
The noisiest health-check endpoint, the trace rate that was fine until launch day, the attribute that should never have been exported: these are usually a code change and a redeploy. With an application policy they are a published version.
Install the OpenTelemetry Operator and its OpAMP bridge, then manage the cluster's Collectors from Logfire. A Kubernetes policy lists the Collector workloads it wants and the Operator makes the cluster match: add one, edit its pipeline, or remove it.
Save as many drafts as you like. A Collector or application only changes when someone publishes a version, so a half-finished edit never reaches production because a tab was left open.
Publishing opens a review of exactly what changes against the running version: the YAML diff for a Collector, the changed settings for an application policy, and how many clients it will reach.
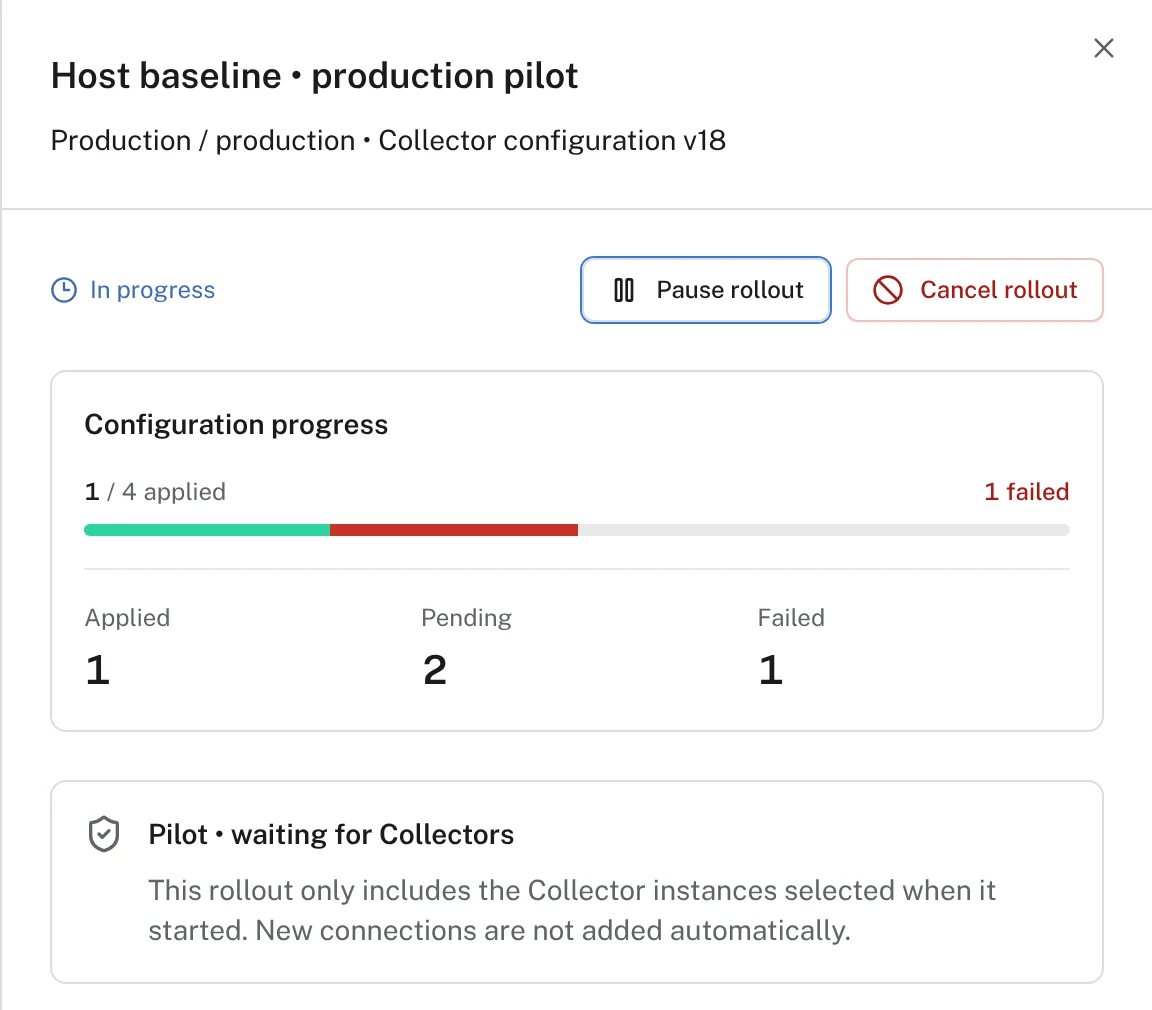
Turn on rollouts and a new version goes to the Collectors you pick first. Progress shows applied, pending and failed per client. Pause stops further sends; cancel ends the rollout.
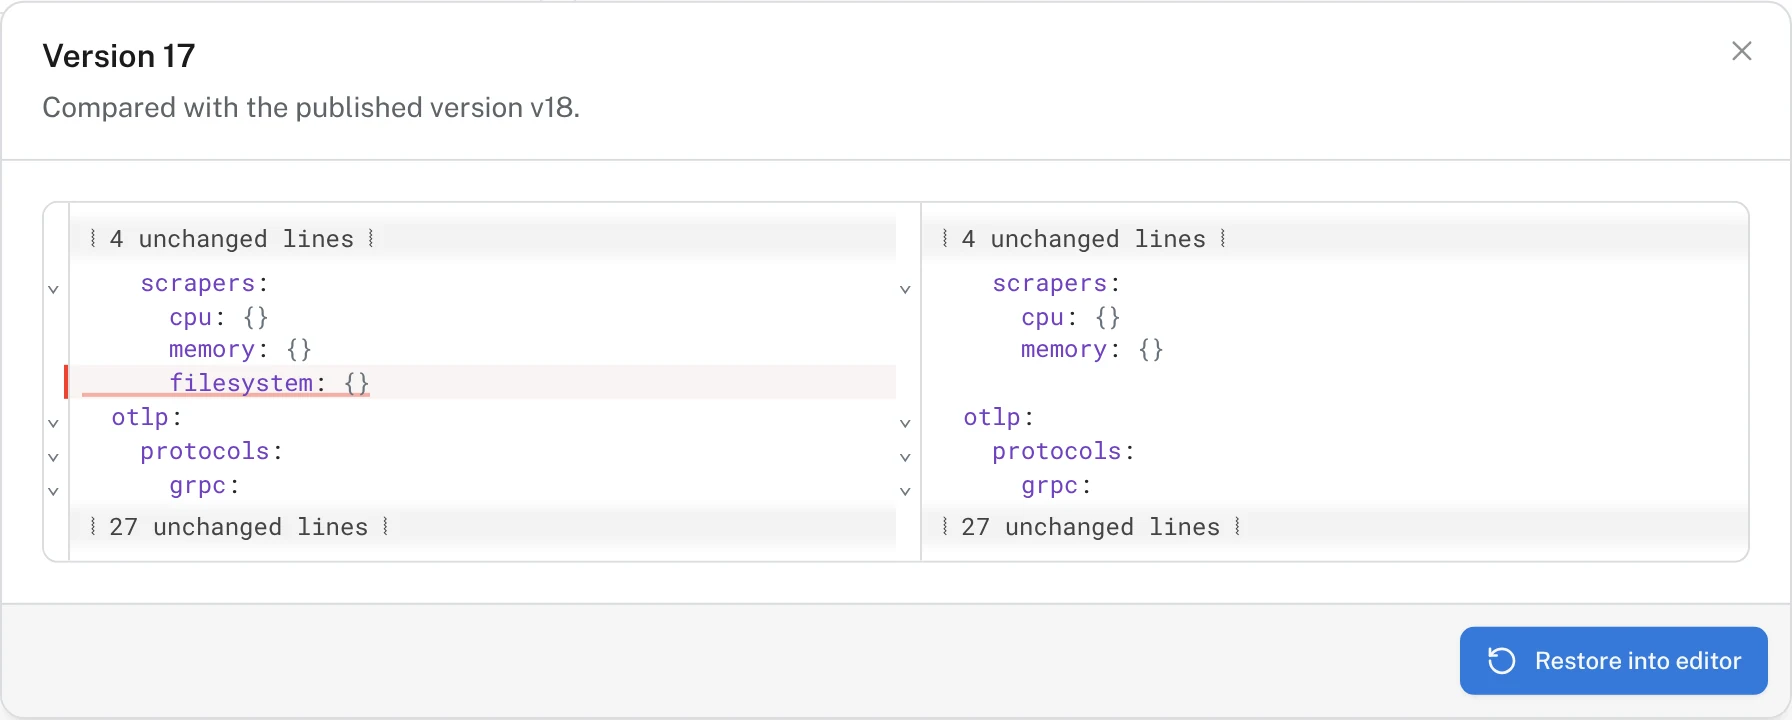
Every published version is kept. Open an earlier one as a diff, restore it into the editor, and publish it again as the next version. The history stays linear, so the audit trail shows the rollback too.
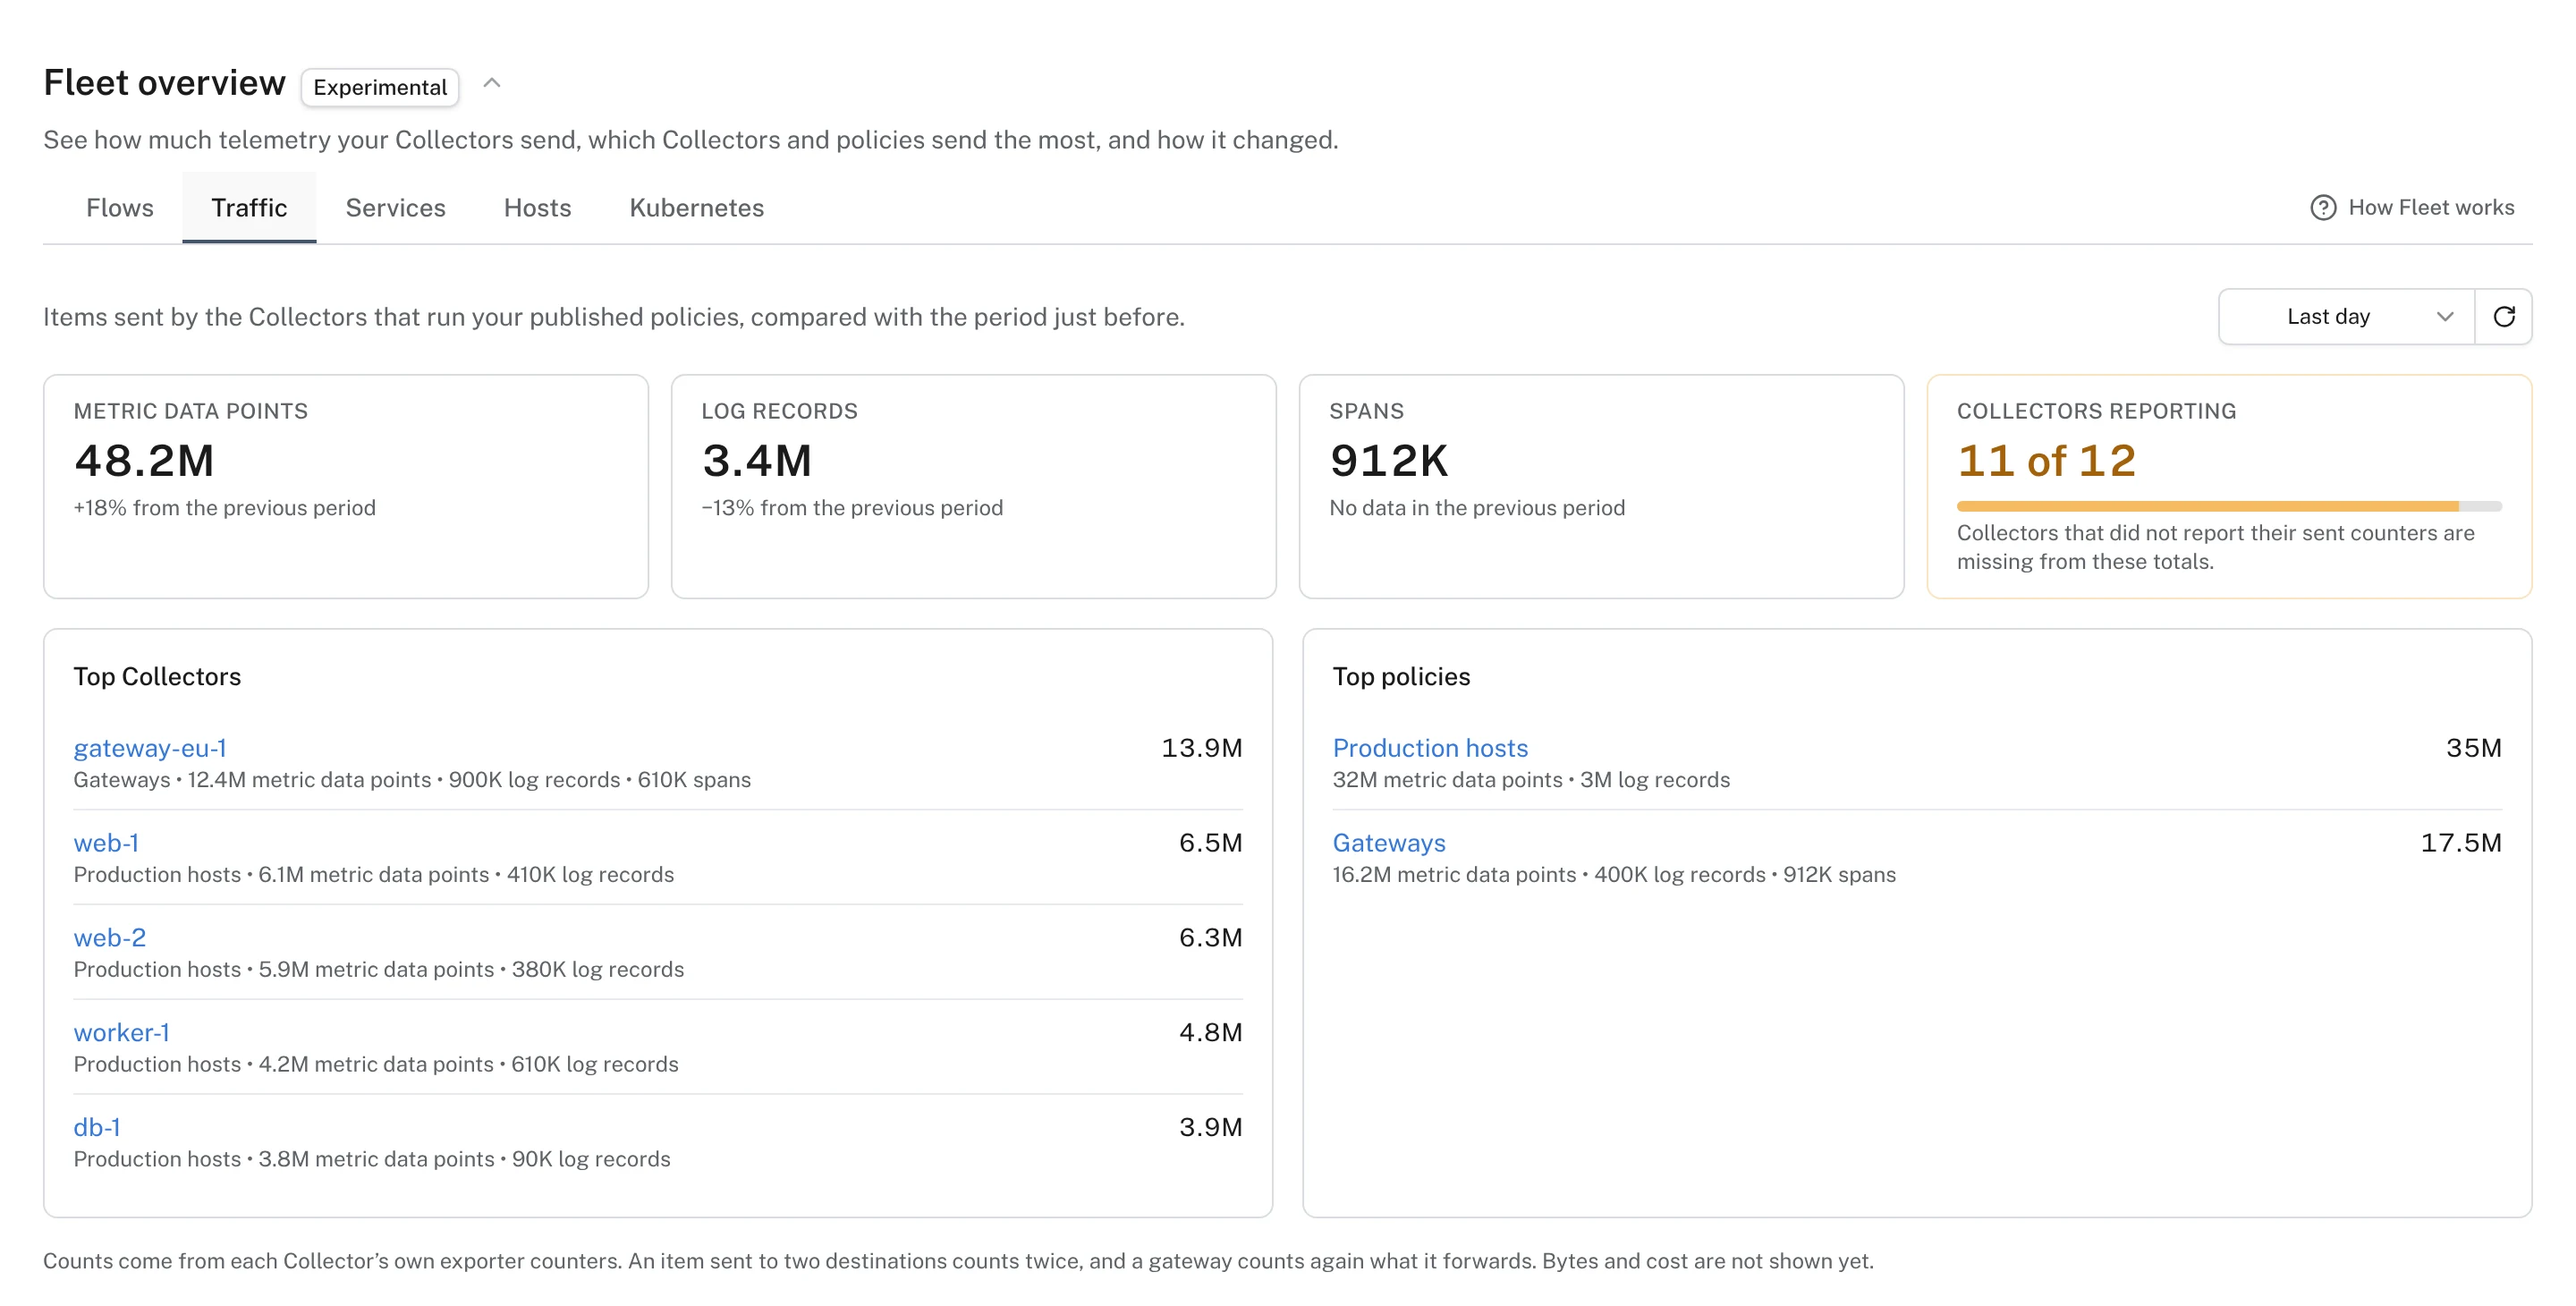
Collectors report their own exporter counters, so Fleet can total what each policy and each Collector sends, signal by signal, and compare it with the period before. The policy that doubled your log volume overnight is at the top of the list.
Fleet Management speaks the OpAMP specification. Host Collectors are upstream OpenTelemetry Collector builds, clusters connect through the OpenTelemetry Operator's own bridge, and the application clients are public on GitHub.
A Collector policy is plain Collector YAML, so the destinations are yours to choose: Logfire, another OTLP backend, an archive, or all three. Manage the agents in Logfire and send the data wherever it needs to go. If you ever stop using Fleet, the last configuration is still a file a Collector can run.
Fleet manages the agents. Infrastructure monitoring covers what they collect: host, container and Kubernetes views, database integrations, and the trace behind an unhealthy pod. Application performance monitoring covers the requests running on top.
Managing the configuration of many telemetry agents from one place: OpenTelemetry Collectors on hosts and in clusters, and the SDKs inside your applications. Instead of editing a file on each machine or redeploying each service, you change a policy centrally and each agent applies it. It also means knowing what every agent is running and whether it is healthy.
The Open Agent Management Protocol is the OpenTelemetry project's protocol for remote agent management. An agent connects to a server, describes itself, reports its health and effective configuration, and can receive new configuration, connection credentials and restart commands. Logfire Fleet Management is an OpAMP server, so it works with clients built to the specification as well as with our own.
No. A Collector policy is ordinary Collector configuration, so its destinations can be Logfire, another OTLP backend, a file archive, or several at once. Fleet manages the agents; where they send data is up to the policy you write.
Yes. Paste it into a new Collector policy in YAML mode. The visual editor works on the same document, preserves comments and settings it does not recognize, and the publish review shows the exact diff before anything changes.
Host Collectors run the upstream OpenTelemetry Collector under an OpAMP Supervisor, which Logfire's command-line installer sets up. Kubernetes clusters connect through the OpenTelemetry Operator's OpAMP bridge. A Collector that only runs the upstream opamp extension reports its health and effective configuration but cannot take new configuration, because the extension does not accept it. Applications use the Logfire OpAMP clients for Python, Node.js, Go, Java and .NET.
The OpAMP client in the application keeps a connection to Logfire. When a new application policy is published, the client applies it to the running SDK: the sampler, the exporters, the minimum log level, and the redaction and scrubbing rules. It reports back whether each setting applied, so the inventory shows which processes are on the new version.
A host or cluster starts with an enrollment key. Clients that support it are then issued a connection key of their own, which can be rotated or revoked one client at a time without touching the others.
Fleet Management is in early access. Contact us and we will turn it on for your organization.
Start free with 10 million telemetry records per month, then ask us to turn on Fleet Management.