See LCP, INP, and CLS across real browser sessions, then resolve slow LCP and INP to the responsible DOM target and follow the click into your backend.
Trusted by teams building production software and AI
Attribution
Find the element behind the slow metric
A page-level LCP of 4.1s tells you that real sessions are struggling. Logfire then points to the hero image driving LCP and the button driving
INP, with sample counts that show how representative each target is.
LCP and INP resolved to the DOM selector responsible, with the sample count behind each figure so you can tell a real problem from a handful of unlucky sessions.
Try it on your stack
Find the slow element, then follow the request
Start free with 10 million spans, logs, and metrics each month. No credit card required.
A slow interaction can start in the browser and finish deep in your application. Page telemetry alone cannot tell you that the request behind it
spent 1.4 seconds in a database query.
Trace context propagates out of the browser and into your API, so the browser span and the server work it caused are one trace.
Replay correlation uses the same browser session and time window, so the recording stays linked to the telemetry around it. Slow page, slow
endpoint and slow SELECT become one connected investigation.
And because it is all one store, the frontend question and the backend question are written the same way:
Worst LCP by page, last 7 days
select
attributes->>'logfire.page.url.path'as page,
approx_percentile_cont(
cast(attributes->>'web_vital.value'asdouble), 0.75
) as p75_ms,
count(*) as measurements
from records
where attributes->>'web_vital.name'='LCP'and start_timestamp > now() -interval'7 days'groupby page
orderby p75_ms desc;
Product surface
From fleet-wide vitals to one failed session
Track distributions, isolate the slow page or element, then inspect the recording and trace behind one experience.
Core Web Vitals with element attribution
Track LCP, INP and CLS as distributions rather than one average. LCP and INP drill down to the DOM targets behind slow samples, with counts that show whether the same image or interaction is hurting many sessions or only a handful.
Session replay with investigation context
With experimental replay enabled for the project, scrub the recording, change speed, skip idle time, and inspect Activity, Network and Console alongside it. Reconstruct the sequence before a bug report without asking someone to remember every click or matching the recording to telemetry by hand.
One trace from browser to database
Trace context propagates from the browser into your API, so the browser span and the server work it caused belong to one trace. Replay is linked to browser telemetry by session and time window, keeping the recording, request, service and database work in one connected investigation.
Errors with the session attached
A frontend exception arrives with the trace it belongs to, so you get the stack, the requests around it, and the recording of what the person was doing. Identical exceptions group into issues, so a new failure mode is one entry rather than a spike in a chart.
Privacy defaults that protect content
Visible text and input values are masked before anything leaves the browser, captured URLs lose query strings and fragments, and console capture is off. Block additional subtrees with selectors and widen capture only after review.
One store, one query language
Browser spans land in the same place as your backend spans, your logs and your metrics, and answer to the same SQL. 'p75 LCP by page for signed-in users last week' is a query rather than a feature request, and it can join to anything else you record.
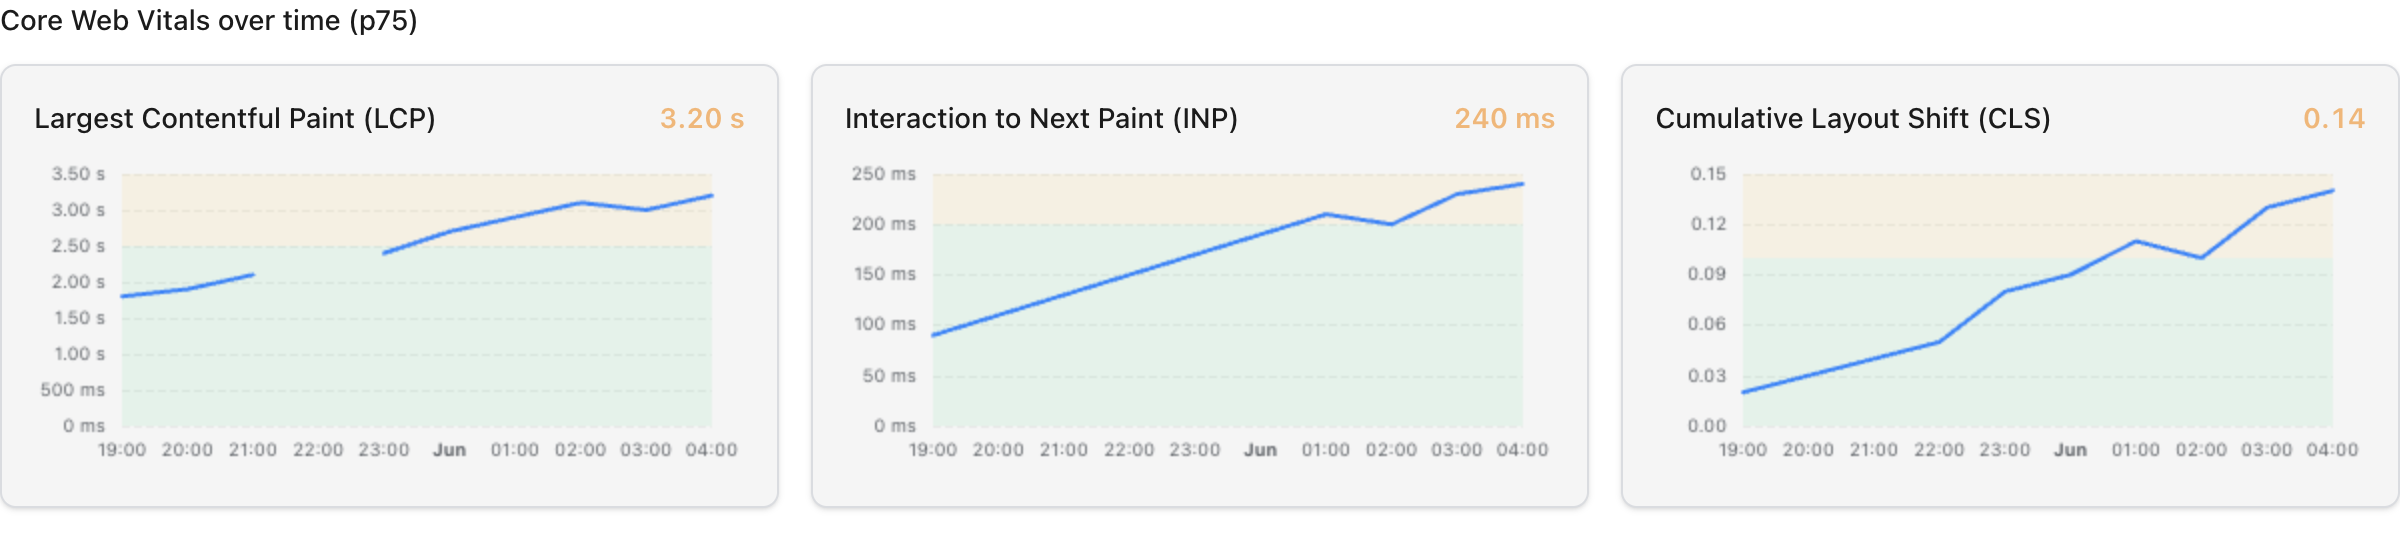
LCP, INP and CLS at p75 over time. Buckets with too few samples are left gapped rather than drawn as a confident line through four data points.
Privacy
Privacy defaults you can verify
Replay is sensitive telemetry, so the recorder starts from restrictive defaults: all visible text and input values are masked, query strings and
fragments are removed from captured URLs, and console capture is off. Block media or any other subtree you never want recorded.
The default recording captures structure and interaction rather than page content. Keep those defaults explicit and review any widening:
Universal text masking takes precedence over selective text selectors. If you decide some visible text is safe to record, disable universal
masking deliberately and retain selector-based masking for every sensitive region.
FAQ
Common questions
What is frontend observability?
Frontend observability is measuring what your application actually did in someone's browser: how long the page took to become useful, how it responded when they interacted with it, what errors they hit, and what the app was doing at the time. It is the same idea as backend tracing applied to the half of the request that happens on a device you do not control.
How is this different from real user monitoring?
Real user monitoring, or RUM, measures performance from actual browser sessions instead of a synthetic test. Frontend observability uses that data together with browser errors, session replay, and trace correlation so a slow page or failed interaction can be investigated across the rest of the application.
Which Core Web Vitals does Logfire report?
The built-in view reports LCP, INP and CLS as distributions across real sessions. LCP and INP also drill down to the DOM targets behind slow samples. The browser SDK records FCP and TTFB as spans too, so those timings remain available for queries and trace-level investigation.
Can I see the backend trace behind a frontend session?
Yes. Trace context propagates from the browser into your API, so a browser span and the server work it caused are part of one trace. Session replay is matched to browser telemetry by the browser session and recording time window, letting you move between the recording and the work that happened around it.
How does session replay handle sensitive data?
Session replay is experimental and must be enabled for your project. Once enabled, all visible text and input values are masked by default before anything leaves the browser, captured URLs lose query strings and fragments, and console capture is off. You can block additional subtrees with selectors, then loosen universal text masking only after deciding which visible text is safe to record.
Which applications does Logfire RUM monitor?
Logfire RUM instruments applications running in a web browser, where it records Core Web Vitals, errors, interactions and session replay. Browser spans can carry trace context into your backend so the session and the work it triggered stay connected. Mobile applications can still send OpenTelemetry traces; the RUM, Core Web Vitals and replay surfaces described here are for browser applications.
What breakdowns are available?
Built-in views report browser sessions by page and country. The underlying browser spans live in the same queryable store as your backend traces, so teams can build product-specific breakdowns with SQL too.
See the click and the query that answered it
Get started with 10 million free spans, logs, and metrics per month. No credit card required.