See live, stale and down hosts at a glance, then inspect CPU, memory, load, disk and network over the same window. Hosts, Kubernetes, containers and databases arrive through standard OpenTelemetry, beside the application traces they affect.
Trusted by teams building production software and AI
Fleet health
The quiet host is the clue
The fleet starts with the decision you need to make: five hosts, three live, one stale and one down. db-1 has stopped reporting;
worker-1 is late; the CPU history shows whether either state followed a gradual decline or a sudden drop.
Open a host for CPU, memory, load, disk and network over the same time range. Kubernetes nodes carry a k8s node label, while metrics
reported by an instrumented application keep their language and service context, so unlike machines do not become identical rows.
Definition
What is infrastructure monitoring?
Infrastructure monitoring is collecting metrics from the machines and services your application runs on: CPU, memory, disk and network per host,
resource usage per container and pod, and the health of the databases, caches and queues around them.
It answers whether the platform is healthy, which is a different question from whether a given request was slow. Explaining an incident
almost always needs both, which is the argument for not keeping them in separate products.
The approach
One collector, not an agent per vendor
Use one OpenTelemetry Collector across hosts, containers, Kubernetes and databases. The same configuration that gathers infrastructure metrics
can enrich and export application traces, giving every signal consistent resource attributes without locking collection to one backend.
The OpenTelemetry Collector becomes a shared collection layer. Host metrics come from hostmetrics, containers from
docker_stats, and Kubernetes from the upstream opentelemetry-kube-stack Helm chart. Logfire adds the fleet views, dashboards,
alerts, and trace correlation on top while the collection pipeline remains standard OpenTelemetry.
This is the smallest useful host setup for the fleet view. The utilization metrics populate its CPU, memory and disk values. The
resourcedetection processor adds the host.name used to group a machine. The endpoint must match the region your project
lives in (logfire-us or logfire-eu), and a receiver only sends anything once it is named in a pipeline.
Add database, container and Kubernetes receivers from the
collector guides as you need them. None of that configuration
is Logfire-specific until the exporter block.
Try it on your stack
Bring one collector
Start free with 10 million spans, logs, and metrics each month. No credit card required.
A fleet inventory with live, stale and down status, OS and architecture, a CPU sparkline, memory, load average and process count, and detail charts for CPU, memory, load, disk and network on any host you open. The standard hostmetrics receiver keeps collection portable while Logfire turns the metrics into an operational view.
Kubernetes
Clusters, nodes, namespaces, workloads, pods and images, with restart counts rolling up at every level so a crash-looping pod is visible from the cluster view rather than only from the pod. Installed with the upstream opentelemetry-kube-stack Helm chart, which is also what wires pod, namespace and deployment names onto your spans.
Containers
Docker containers, images and Compose projects through the docker_stats receiver, with CPU, memory, block IO and network per container. Useful on its own for a single-box deployment, and the same data whether you run one container on a VM or a fleet under an orchestrator.
Logs from the platform, not just the app
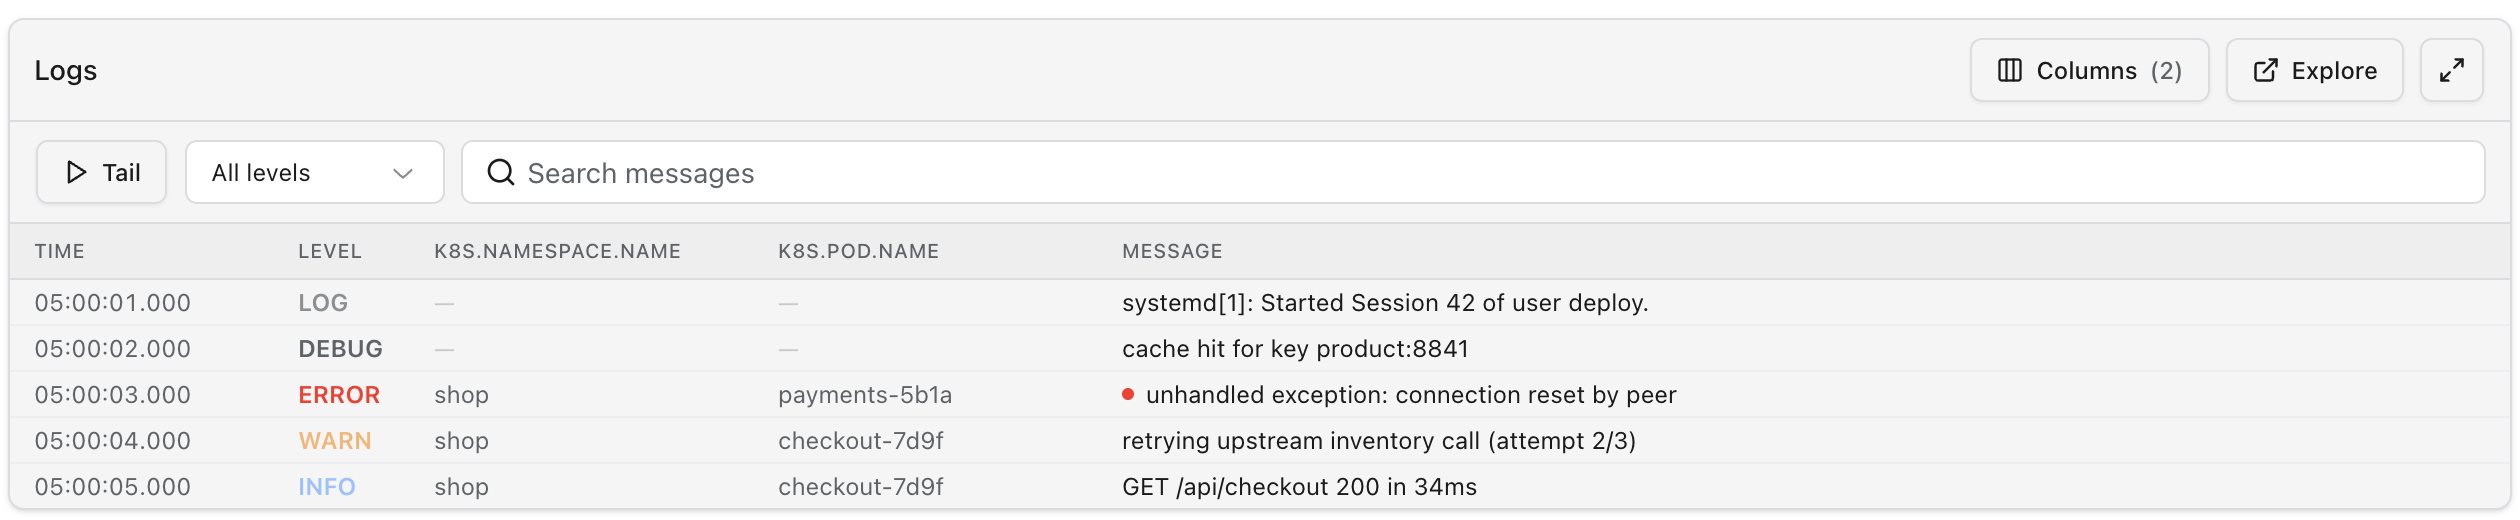
Container stdout, systemd journal entries and Kubernetes events land as log records in the same store as your spans and metrics. Shared resource attributes and time ranges make it straightforward to connect a restart with the requests that failed around it.
Alerts on the same SQL
An alert is a query on a schedule, so anything you can ask about your infrastructure you can also be told about. Disk above 85 percent on any host, a pod restarting more than three times an hour, replication lag over a threshold, all written the same way as the query you used to find the problem the first time.
Integrations
Production-ready dashboards and alerts
Logfire ships curated infrastructure integrations that combine deep dashboards, alert templates, and the setup guidance needed to produce the
metrics they read. The selection below highlights familiar databases, caches, queues, and web servers from a catalog that continues to grow.
MySQL
56 panels·7 alerts
Buffer pool pages, index I/O wait time, connection errors
Commits and rollbacks, checkpoint duration, index scans
Redis
40 panels·6 alerts
Keyspace hit ratio, evictions per second, memory fragmentation
RabbitMQ
33 panels·8 alerts
Queue depth ready vs unacknowledged, publish and deliver rates
Kafka
32 panels·3 alerts
Consumer lag, under-replicated partitions, production rate by topic
Memcached
26 panels·3 alerts
Hit ratio by operation, evictions per second, current items
Apache
23 panels·2 alerts
Workers by state, scoreboard, requests per second
NGINX
17 panels·2 alerts
Connections by state, accepted vs handled, keep-alive idle
Detect and install reads what you are already sending and installs the integrations that match, so the "which of these apply to me"
step is a button rather than an afternoon.
The integrations shown here alone include 50 ready-to-use alerts with technology-specific thresholds: Redis approaching its configured
memory limit, a RabbitMQ queue with no consumer, Kafka under-replicated partitions, and database connection failures surface without rebuilding the
same operational knowledge from scratch.
OpenTelemetry ecosystem
Bring the rest through OpenTelemetry
Built-in integrations accelerate the systems teams monitor most often. The OpenTelemetry Collector's
receiver ecosystem extends that coverage across the rest of your stack,
and anything that speaks OTLP can send telemetry directly.
For all of that, the dashboard is a conversation. Logfire is an MCP server, so the coding agent you already use can read your
actual telemetry, work out which attributes you are sending, and create the dashboards and alerts against them. Ask for "a dashboard for our
queue workers and an alert when the backlog outlives its SLO" and it writes the queries, because the queries are SQL over the same table
everything else lands in.
The result is production-ready coverage for popular infrastructure and an open path for every other service. Built-in or custom, the metrics
land in the same query model, use the same dashboard primitives, and correlate with the same traces and logs.
Platform logs
Container stdout and journald, in the same table
A systemd journal line and an application request log, one table apart. Any resource attribute the collector attached, pod, namespace, node: can be promoted to a column and filtered on, which is what makes 'what else was happening on that pod' a question you can actually ask.
The connection
From a pod to the requests it served
This is the part that is hard to do with two products. The Helm chart wires the k8sattributes processor into the trace pipeline,
not just the metrics one, so your spans carry k8s.pod.name, k8s.namespace.name and k8s.deployment.name as resource
attributes.
A pod that looks unhealthy and the requests it degraded stop being two dashboards and a hypothesis. They become one query:
Which pods threw the errors in the last hour
select
otel_resource_attributes->>'k8s.pod.name'as pod,
count(*) as errors
from records
where otel_resource_attributes->>'k8s.pod.name'isnot nulland is_exception
and start_timestamp > now() -interval'1 hour'groupby pod
orderby errors desc;
Group by the deployment name instead and you are asking about the rollout. Join to the host metrics and you are asking whether the node was
saturated. It is the same table either way, which is the whole point of collecting it into one place.
Portable by design
Own the collection layer
Run the upstream OpenTelemetry Collector as a process on hosts or a DaemonSet in clusters. You control its configuration, resource limits,
upgrades, and exactly which telemetry leaves each environment.
Because collection is standard OpenTelemetry, adding another source or changing an exporter does not require replacing your instrumentation.
Logfire turns that portable telemetry into infrastructure views, SQL, dashboards, alerts, and application context.
In production
Teams running platforms on Logfire
“
You can tell that Pydantic Logfire was built by people who use it.
Infrastructure is one layer. Application performance monitoring covers the requests running on top of it, and the
language pages carry the framework and driver specifics for instrumenting them. All three land in the same store, and
answer to the same queries.
FAQ
Common questions
What is infrastructure monitoring?
Infrastructure monitoring is collecting metrics from the machines and services your application runs on: CPU, memory, disk and network on each host, container and pod resource usage, and the health of the databases, caches and queues around them. It answers whether the platform is healthy, which is a different question from whether a given request was slow, and you usually need both to explain an incident.
Do I need to install a Logfire agent?
Infrastructure data reaches Logfire through the OpenTelemetry Collector, the same open collection layer that ships your traces. Hosts use the standard hostmetrics receiver, containers use docker_stats, and Kubernetes uses the upstream opentelemetry-kube-stack Helm chart. Your configuration stays readable, inspectable, and portable across OTLP backends.
Can I go from a Kubernetes pod to the traces it served?
Yes, and this is the main reason to have infrastructure and application telemetry in one place. The Helm chart wires the k8sattributes processor into the trace pipeline, so spans carry pod, namespace and deployment names as ordinary attributes. A pod that looks unhealthy and the requests it actually served are then the same query rather than two products and a guess.
Which databases and services have integrations?
Logfire ships curated integrations for popular databases, caches, queues, web servers, and data systems. Each integration in the current public catalog combines a dashboard, health alerts, and collector setup guidance. Detect and install finds matches in your telemetry automatically, and the in-product catalog continues to grow as new integrations ship.
How are Kubernetes events handled?
Kubernetes events arrive as structured log records, where they can be queried, correlated with traces and metrics, promoted into dashboard panels, and used in SQL alerts. Keeping them in the shared telemetry store makes a restart, the affected pod, and the requests around it part of the same investigation.
Can I monitor infrastructure without instrumenting my application?
Yes. The collector produces host, container, Kubernetes and service metrics with no application changes at all, so you can start there and add tracing later. The two get more useful together, because that is what turns 'this node is saturated' into 'and here are the requests it degraded', but neither requires the other.
How does infrastructure data count against my quota?
Metrics count as records like spans and logs do. Personal includes 10 million records a month and pauses ingestion at the limit; Team and Growth include the same allowance, then charge $2 per million additional records. Collection interval is the main lever: scraping every 30 seconds instead of every 10 cuts volume by two thirds, and for most host metrics changes nothing you would have acted on.
Point your collector at Logfire
Get started with 10 million free spans, logs, and metrics per month. No credit card required.