Debug a slow endpoint
A user reports that /checkout is slow. You have a hunch it’s the database, but you can’t prove it, and
you can’t tell which query. This walkthrough takes you from “it feels slow” to a named, fixed cause, using
Logfire to look inside the request rather than just clocking it from the outside.
You’ll instrument a FastAPI app and its PostgreSQL database, watch a slow request arrive in the Live view, expand it to see the SQL query that’s eating the time, confirm the pattern across all your traffic in Explore, and then fix it and watch the duration drop.
Who this is for: backend and site-reliability engineers who own a web service and its database, and want to know why a request is slow, not just that it is.
Time: about 15 minutes.
Two terms you’ll meet throughout, in case they’re new: a span is one unit of work: a single operation with a name, a start, and a duration (an HTTP request, a database query). A trace is the full journey of one request, made of those spans nested inside each other. Full-stack tracing is the whole point of this walkthrough: when the request span contains the query span, you can see which part of the request was slow.
-
A Logfire project and its write token. The write token is the credential your app uses to send data to Logfire. Create a project and copy its token from Project → Settings → Write tokens in the Logfire web app, and set it as
LOGFIRE_TOKENin your environment before running the app. New to Logfire? Getting Started walks through creating a project and linking your machine. -
A running PostgreSQL database. If you don’t have one handy, start a throwaway one with Docker:
Terminal docker run --rm --name postgres \ -e POSTGRES_USER=user \ -e POSTGRES_PASSWORD=secret \ -e POSTGRES_DB=database \ -p 127.0.0.1:5432:5432 \ -d postgresThis gives you a database reachable at
postgres://user:secret@localhost:5432/database. -
Python packages. You need FastAPI, the Psycopg 3 driver, Logfire’s instrumentation for each, and a server to run the app. The
[fastapi,psycopg]extras ship the instrumentation, not the libraries themselves:Terminal pip install fastapi 'psycopg[binary]' 'logfire[fastapi,psycopg]' uvicorn
The trick to seeing inside a request is to instrument both layers: FastAPI, so each HTTP request becomes a span, and Psycopg, so each SQL query becomes a span nested inside it. Three calls do this.
The app below has a deliberately slow /checkout endpoint: it looks up a user’s cart by scanning an
order_items table that has no index on user_id, so PostgreSQL reads the whole table on every request.
The setup code seeds enough rows to make the problem visible.
from contextlib import asynccontextmanager

import psycopg
from fastapi import FastAPI

import logfire

DSN = 'dbname=database user=user password=secret host=localhost port=5432'


def seed_data() -> None:
    """Create a table with no index on user_id and fill it with rows."""
    with psycopg.connect(DSN) as conn, conn.cursor() as cur:
        cur.execute(
            'CREATE TABLE IF NOT EXISTS order_items '
            '(id serial PRIMARY KEY, user_id integer, product text, price numeric)'
        )
        cur.execute('SELECT count(*) FROM order_items')
        (count,) = cur.fetchone()
        if count == 0:
            # 10M rows so the unindexed scan is genuinely slow; user_id is sparse, so
            # few rows match each lookup, which is exactly what adding an index fixes.
            cur.execute(
                'INSERT INTO order_items (user_id, product, price) '
                "SELECT mod(i, 100000), 'product-' || i, mod(i, 100) "
                'FROM generate_series(1, 10000000) i'
            )
        conn.commit()


@asynccontextmanager
async def lifespan(app: FastAPI):
    seed_data()  # runs once, on startup
    yield


app = FastAPI(lifespan=lifespan)

logfire.configure()  # connect to your Logfire project
logfire.instrument_fastapi(app)  # every request becomes a span
logfire.instrument_psycopg()  # every SQL query becomes a span, nested inside the request


@app.get('/checkout')
def checkout(user_id: int):
    with psycopg.connect(DSN) as conn, conn.cursor() as cur:
        # No index on user_id, so this scans the whole table on every request.
        cur.execute('SELECT product, price FROM order_items WHERE user_id = %s', (user_id,))
        items = cur.fetchall()
    return {'user_id': user_id, 'item_count': len(items)}


if __name__ == '__main__':
    import uvicorn

    uvicorn.run(app)
Run it with python main.py. The first run seeds 10 million rows, which can take a minute, so wait until
uvicorn logs that it’s listening before sending a request to generate a trace:
curl 'http://localhost:8000/checkout?user_id=42'
What you’ll see in Logfire: open the Live view (the project’s home page)
and within a second or two a GET /checkout trace appears. See Instrument FastAPI
and Instrument Psycopg for everything these two calls capture.
The Live view streams traces as they arrive. To find slow ones specifically,
click Search your spans (keyboard shortcut /) to open the search pane. You’re writing the WHERE clause
of a SQL query over your traces. Filter to slow /checkout requests:
span_name = 'GET /checkout' AND duration > 0.05
duration is in seconds, so this finds requests slower than 50 ms. Press Run (or cmd+enter;
ctrl+enter on Windows and Linux). Your curl request should be right there. A full-table scan over
10 million rows takes 100 ms or more, far longer than a keyed lookup should.
Not comfortable writing SQL? The search pane also takes a plain-language question (“slow checkout requests”) and converts it to SQL for you. See the Live view guide for both aids.
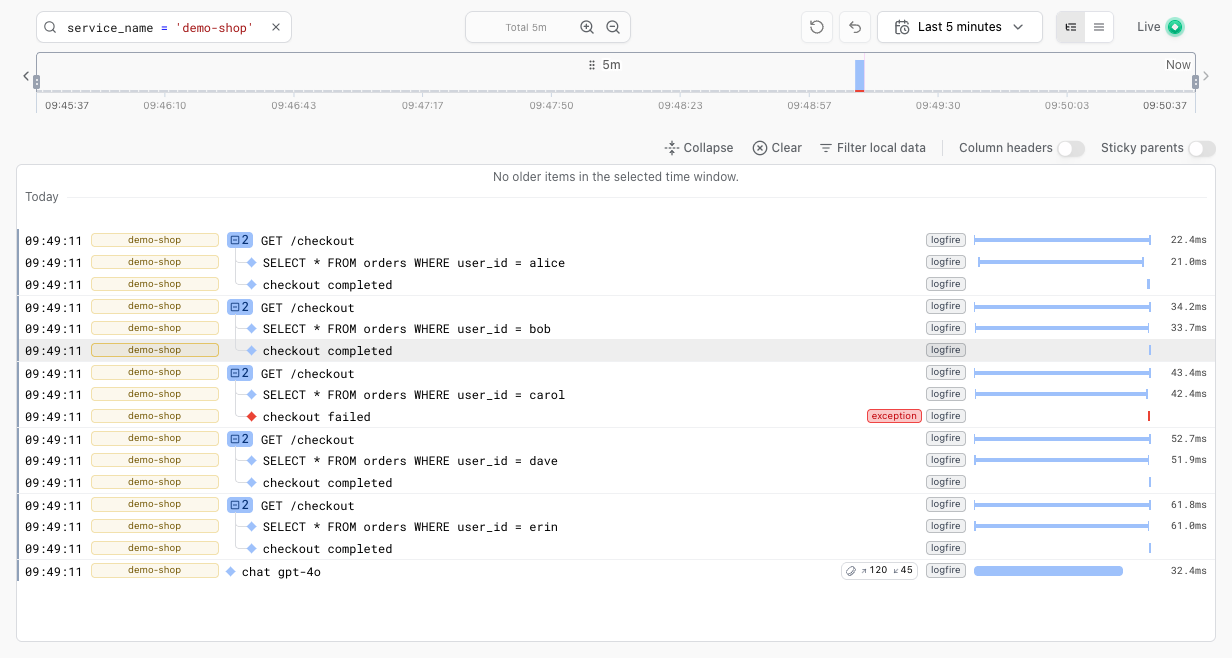
Click the trace to open it. The GET /checkout span has a + beside it, meaning it has child spans.
Expand it. Nested inside the request you’ll see the SQL query span from Psycopg, and its duration bar fills
almost the entire width of the request: the query is nearly all of the time.
This is the payoff of instrumenting both layers. Without the query span you’d know only that the request was
slow; with it, you can see which operation inside the request is to blame: here, the
SELECT ... FROM order_items WHERE user_id = ... statement. Click the query span to read its full SQL and
timing in the details panel.
One slow request could be a fluke. Before you change anything, confirm it’s a pattern. First, generate a little traffic so there’s more than one request to aggregate:
for i in $(seq 1 20); do curl -s "http://localhost:8000/checkout?user_id=$i" > /dev/null; done
Then open Explore, where you write SQL over the records table: one row per
span or log.
Which endpoints are slowest? This ranks your endpoints by their typical (median) and slow-tail (95th percentile) durations:
SELECT
  span_name,
  count(*) AS requests,
  approx_percentile_cont(duration, 0.5) * 1000 AS p50_ms,
  approx_percentile_cont(duration, 0.95) * 1000 AS p95_ms
FROM records
WHERE attributes ? 'http.route'
GROUP BY span_name
ORDER BY p95_ms DESC
Which queries are slowest? Database query spans carry the statement in the db.statement attribute.
This ranks them:
SELECT
  attributes->>'db.statement' AS query,
  count(*) AS runs,
  approx_percentile_cont(duration, 0.95) * 1000 AS p95_ms
FROM records
WHERE attributes ? 'db.statement'
GROUP BY query
ORDER BY p95_ms DESC
For each query, set Time window (next to Run) to a period with real traffic, for example Last day,
and raise Limit if you have many endpoints. Press Run (cmd+enter; ctrl+enter on Windows and Linux). The order_items query should sit at
the top, confirming this isn’t a one-off.
Prefer to look at it as a ranked service dashboard rather than raw SQL? The Services view shows every service ranked by request rate, error rate, and latency (the 95th and 99th percentiles), and its Top operations panel surfaces the slowest spans inside a service: the same finding, one click away.
The query scans the whole order_items table because there’s no index on user_id. Add one:
CREATE INDEX order_items_user_id_idx ON order_items (user_id);
Run that against your database (for the Docker setup: psql postgres://user:secret@localhost:5432/database),
then send the same request again:
curl 'http://localhost:8000/checkout?user_id=42'
What you’ll see in Logfire: back in the Live view, the new GET /checkout
trace arrives, and the query span inside it now takes a fraction of what it did before. PostgreSQL jumps
straight to the matching rows instead of reading the whole table. To confirm it in aggregate, send a fresh
batch of requests (the same curl loop from step 4) and re-run the step-4 Explore query over just the last
minute, so it excludes the earlier slow requests: the order_items query’s p95 has dropped.
You started with “a user says /checkout is slow” and finished with a named, fixed cause: a missing index
on order_items.user_id that forced a full-table scan on every request. The thing that got you there was
seeing the SQL query inside the request span. Full-stack tracing turned “the request is slow” into “this
query is slow,” which is the difference between guessing and knowing.
curlconnection refused? Postgres isn’t up yet, or the first run is still seeding 10 million rows. Wait until uvicorn logs that it’s listening.- No
GET /checkouttrace in the Live view? Check thatLOGFIRE_TOKENis set and thatinstrument_fastapiandinstrument_psycopgrun before the request. - Query isn’t slow? The scan only hurts with enough rows. Confirm the seed inserted 10 million rows with
SELECT count(*) FROM order_items.
- Instrument FastAPI: everything the request spans capture, including parsed arguments and validation errors.
- Instrument Psycopg: options for what to instrument, and adding context to your query spans.
- Debug a slow tool call: the same trace-driven technique when the slow layer is an agent’s tool, not the database.
- Explore: the full SQL surface over your telemetry, including metrics.
- Alerts: turn the “slowest endpoints” query into a scheduled check that notifies you when latency creeps back up, so you don’t have to watch the Live view yourself.