Send traces from Rust
See what your Rust application is doing in Logfire: the work it performed, how long each step took, and which steps failed. This takes about five minutes.
Rust has a dedicated Logfire SDK, the logfire crate. It builds on OpenTelemetry (OTel), the open industry standard for collecting traces, metrics, and logs, and on the popular tracing library, so it fits code you have already instrumented. You get traces (the full journey of one request, made of nested spans, where a span is one unit of work with a name, a start, and a duration) in the Logfire UI with a few lines of setup.
You need:
- A Logfire project and a write token (the credential your app uses to send data to a Logfire project). Copy one from Project → Settings → Write tokens; see Create Write Tokens.
- A working Rust toolchain (
cargo).
The token encodes which data region your project is in (US or EU), so the SDK sends to the correct place automatically. You do not set an endpoint. Running a self-hosted Logfire? Set LOGFIRE_BASE_URL to your instance’s URL.
1. Create a project and add the crate
cargo new hello-rust
cd hello-rust
cargo add logfire
cargo add adds a line like logfire = "0.11" to your Cargo.toml. Already have a project? Run cargo add logfire in it.
2. Add the code
fn main() -> Result<(), Box<dyn std::error::Error>> {
    // Reads LOGFIRE_TOKEN from the environment. The region is taken from the token.
    let logfire = logfire::configure()
        .send_to_logfire(logfire::config::SendToLogfire::IfTokenPresent)
        .with_service_name("hello-rust")
        .finish()?;

    // The guard flushes and shuts Logfire down when it goes out of scope (end of main).
    let _guard = logfire.shutdown_guard();

    // A span records one operation; the log inside it is nested in that span.
    logfire::span!("hello").in_scope(|| {
        logfire::info!("Hello world");
    });

    Ok(())
}
3. Run it
export LOGFIRE_TOKEN=your-write-token
cargo run
Open the Live view in Logfire. Your hello trace appears as it arrives:
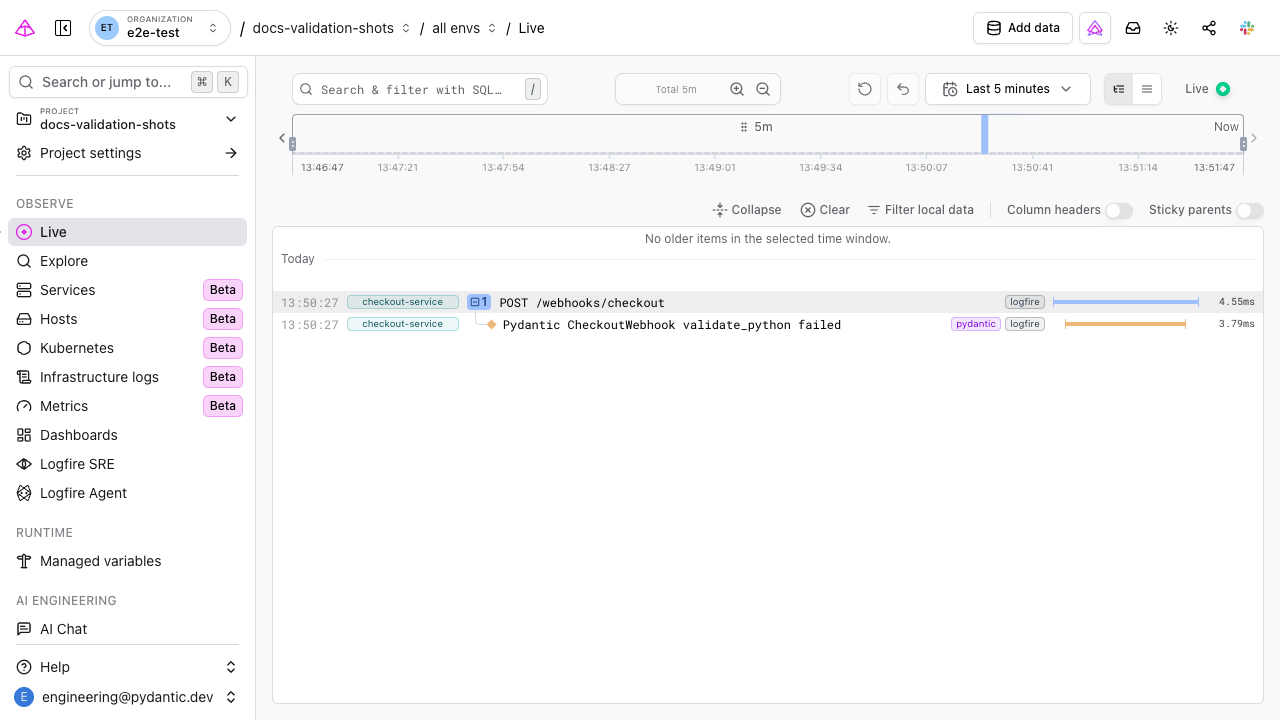
Each row is one span, with its service, name, and duration. The screenshot shows a busier app; your run appears as its own row, service hello-rust and span hello. Click it to open the full trace: the Hello world log is nested inside.
| Symptom | Likely cause | Fix |
|---|---|---|
| Nothing appears in Logfire, and there’s no error | LOGFIRE_TOKEN is not set: with IfTokenPresent, a missing token disables sending silently | Set the LOGFIRE_TOKEN environment variable |
| The token is set but nothing appears | Records are buffered and sent on shutdown | Keep the let _guard = logfire.shutdown_guard(); binding alive for the whole run, or call .shutdown() explicitly |
| Can’t tell what is happening | No local visibility | Add .with_console(Some(logfire::config::ConsoleOptions::default())) when configuring to print records to your terminal, or set RUST_LOG to see the SDK’s own logs |
- New to tracing? Core concepts explains spans and traces and how to read them.
- Want the full API? Read docs.rs/logfire and the source at github.com/pydantic/logfire-rust; record your own work with the
logfire::span!andlogfire::info!macros. - Prefer raw OpenTelemetry? See Alternative clients for the standard OpenTelemetry SDK instead of the
logfirecrate.