Send Claude Platform traces to Logfire
See what Claude did for each request your app sends: every Claude Managed Agents turn, each model call, each tool the agent ran, and the tokens it used.
There are two parts:
- Add Logfire in the Claude Console. Anthropic then sends Claude’s spans to Logfire for every request, from any language, with no code changes. A span is one unit of work, such as a model call, with a name, a start, and a duration.
- Optional: link them to your app. Add
logfire.configure()to your Python app, and Claude’s spans appear inside your own traces (the full journey of one request, made of nested spans).
| Span | What it shows |
|---|---|
anthropic.session.turn | One Managed Agents turn: the conversation, including the system prompt and tool calls. |
anthropic.tool_use <tool> | A tool the agent ran, such as bash or web search, with its input and output. |
anthropic.messages.create | One Messages API request: the prompt and the response. |
anthropic.model_request | One model call: the model, token usage, and timing. It has no prompt or response. |
Claude’s spans have the service name claude-platform. Spans from your own app have your app’s service name.
You need:
- A Logfire project and a write token (the credential that lets a service send data to a project), from Settings → Write tokens in your project.
- The admin role in your organization in the Claude Console. This is the organization that owns your API keys, which is separate from any claude.ai organization.
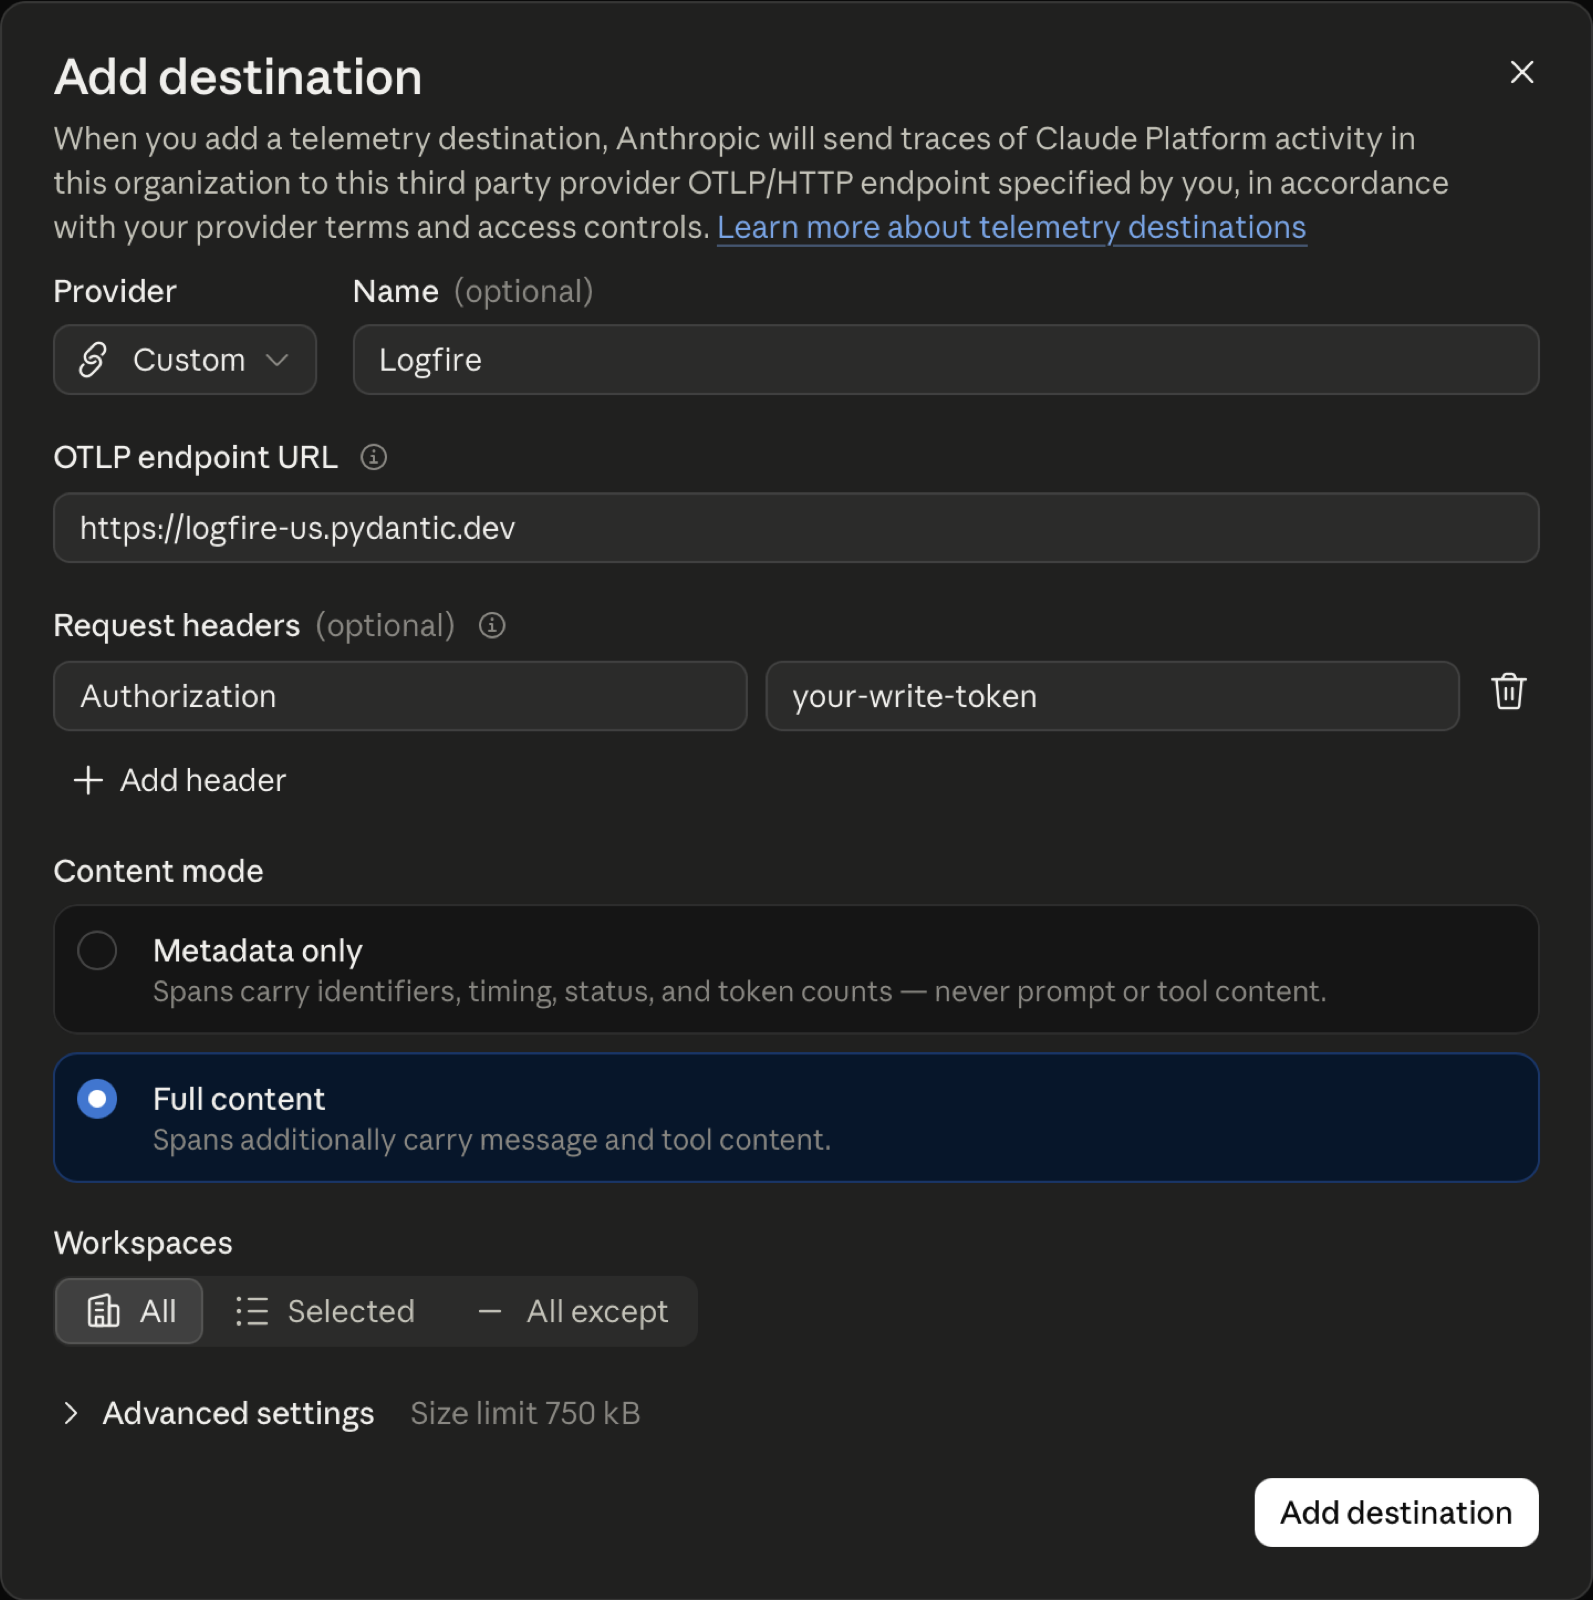
- Open the Console’s OpenTelemetry settings and click Add destination.
- Leave Provider as Custom, and set Name to
Logfire. - Set OTLP endpoint URL to the address of your Logfire data region. Don’t add a path: the Console adds it.
https://logfire-us.pydantic.dev
https://logfire-eu.pydantic.dev
- Under Request headers, add a header named
Authorizationwith your write token as the value. Paste the token on its own, withoutBearerin front. - Choose a Content mode: Full content to read conversations in Logfire, or Metadata only to leave them out.
- Under Workspaces, choose which Claude workspaces send spans: All, Selected, or All except.
- Click Add destination.
Check it: open the destination’s ⋮ menu and click Test. An anthropic.test span appears in Logfire’s Live view within about a minute. After your next real request, the Delivery column shows Healthy.

That’s all you need to see Claude’s spans in Logfire. Each request shows up as its own trace.
This step puts Claude’s spans inside the trace of the code that made the call, so you can see which user request or job asked Claude for what.
Install logfire and the Claude SDK (version 1.14.0 or later):
pip install logfire anthropic
Call logfire.configure() before you create the client. You don’t need any other setup: the SDK sends its spans through Logfire, and tells Claude which of your spans made each call.
from anthropic import Anthropic

import logfire

logfire.configure()

client = Anthropic(open_telemetry={'traces': {'content_mode': 'content'}})

with logfire.span('fibonacci agent'):
    environment = client.beta.environments.create(
        name='fibonacci-env',
        config={'type': 'cloud', 'networking': {'type': 'limited', 'allow_package_managers': True}},
    )
    agent = client.beta.agents.create(
        name='Fibonacci agent',
        model='claude-sonnet-5-5',
        system='You are a helpful coding assistant. Keep replies short.',
        tools=[{'type': 'agent_toolset_20260401'}],
    )
    session = client.beta.sessions.create(agent=agent.id, environment_id=environment.id)

    with client.beta.sessions.events.stream(session.id) as stream:
        client.beta.sessions.events.send(
            session.id,
            events=[
                {
                    'type': 'user.message',
                    'content': [
                        {'type': 'text', 'text': 'Print the first 10 Fibonacci numbers with a one-line Python command.'}
                    ],
                }
            ],
        )
        for event in stream:
            if event.type == 'agent.message':
                print(''.join(block.text for block in event.content if block.type == 'text'))
            elif event.type == 'session.status_idle':
                break
The agent runs the command in its sandbox and replies with something like:
Output: `0 1 1 2 3 5 8 13 21 34`
from anthropic import Anthropic, beta_tool

import logfire

logfire.configure()

client = Anthropic(open_telemetry={'traces': {'content_mode': 'content'}})


@beta_tool
def get_weather(city: str) -> str:
    """Get the current weather for a city.

    Args:
        city: The city name, for example Berlin.
    """
    return f'Cloudy, 15°C in {city}'


with logfire.span('answer question'):
    runner = client.beta.messages.tool_runner(
        model='claude-haiku-5-5',
        max_tokens=1024,
        tools=[get_weather],
        messages=[{'role': 'user', 'content': 'What is the weather in Berlin?'}],
    )
    for message in runner:
        pass
    print(message.content[-1].text)
Claude calls get_weather in your app, then replies with something like:
It's currently cloudy in Berlin, with a temperature of 15°C.
open_telemetry={'traces': {'content_mode': 'content'}} adds prompts and responses to your app’s spans too. Leave it out to keep them to metadata only, unless the environment variable ANTHROPIC_OPEN_TELEMETRY_TRACES_CONTENT_MODE is set to content.
Good to know:
- Web apps: if you already instrument your web framework, Claude’s spans appear under each incoming request, for example
GET /chat, with no extra code. - Sampling: if you sample traces in
logfire.configure(), Claude follows your choice. A trace you don’t keep has no Claude spans.
Give related calls the same conversation_id. The SDK records it as gen_ai.conversation.id on your app’s spans. It is sent in both content modes, so don’t put personal data in it.
from anthropic import Anthropic

import logfire

logfire.configure()

client = Anthropic()
conversation = client.with_options(open_telemetry={**client.open_telemetry, 'conversation_id': 'conv_42'})

conversation.messages.create(
    model='claude-haiku-5-5',
    max_tokens=100,
    messages=[{'role': 'user', 'content': 'Hello, Claude'}],
)
Claude reads your trace context from the traceparent request header. If you call the API with httpx, logfire.instrument_httpx() adds that header for you. Install the httpx extra first:
pip install 'logfire[httpx]'
Then:
import os

import httpx

import logfire

logfire.configure()
logfire.instrument_httpx()

with logfire.span('summarize'):
    response = httpx.post(
        'https://api.anthropic.com/v1/messages',
        headers={
            'x-api-key': os.environ['ANTHROPIC_API_KEY'],
            'anthropic-version': '2023-06-01',
        },
        json={
            'model': 'claude-haiku-5-5',
            'max_tokens': 100,
            'messages': [{'role': 'user', 'content': 'Hello, Claude'}],
        },
        timeout=60,
    )
    print(response.json()['content'][0]['text'])
With another HTTP client, add the header yourself with opentelemetry.propagate.inject(headers) before you send the request.
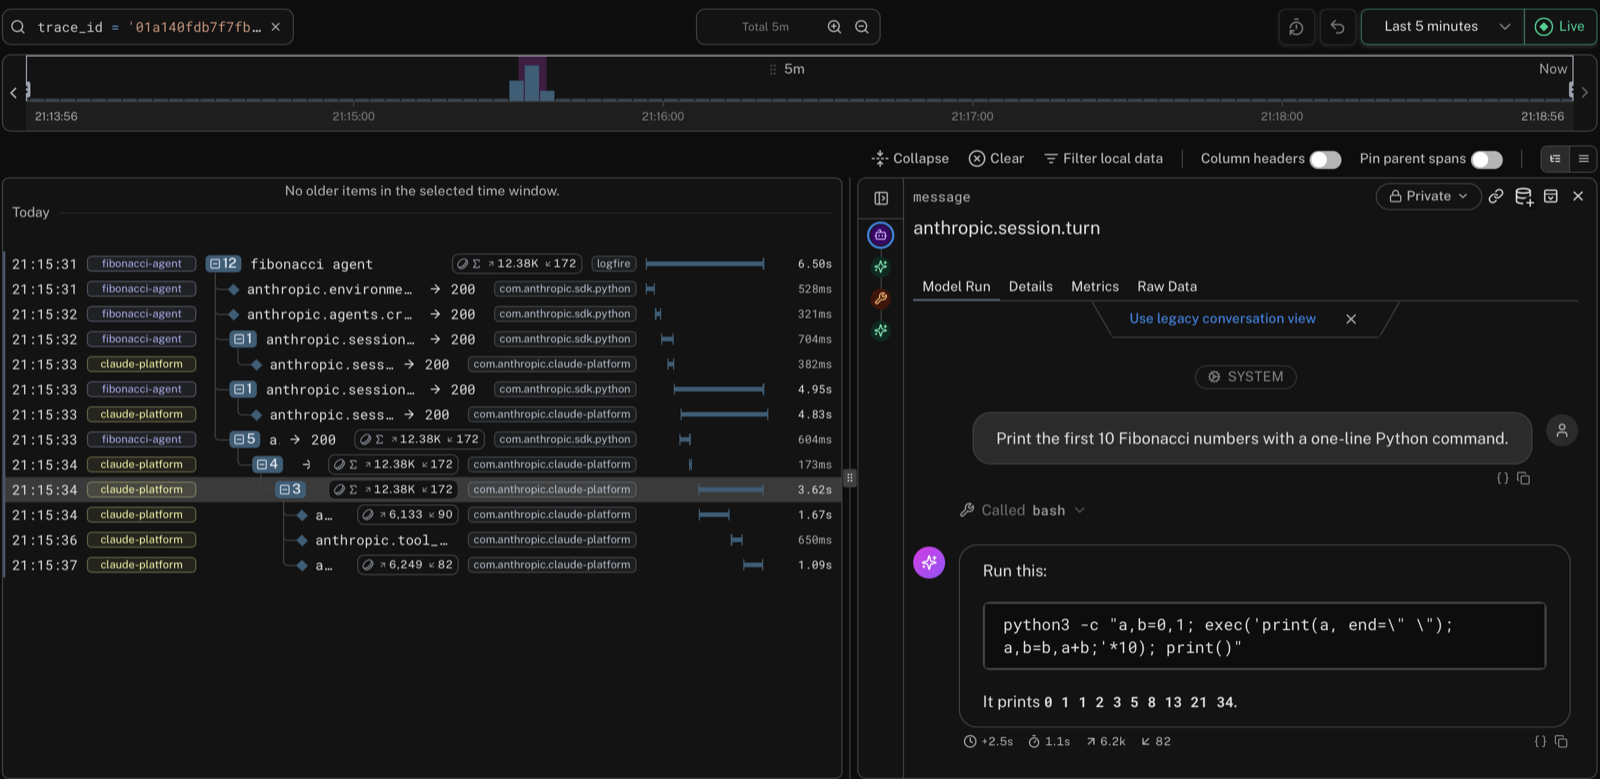
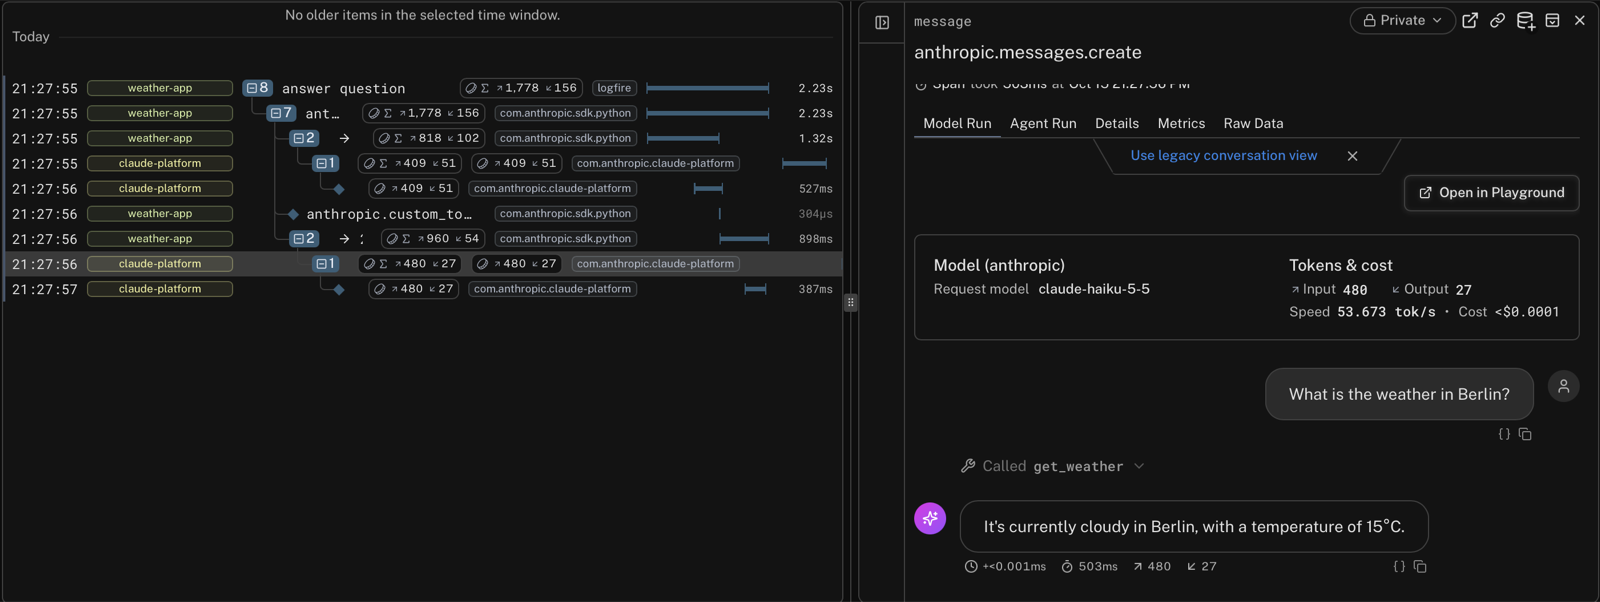
Run an example, then open the Live view. Within about a minute you should see your trace. Expand it to see your app’s spans with Claude’s spans under them. Click a span to read the conversation, with the model, tokens, and cost.
A Managed Agents session, with the turn open:
A Messages API request, with the second call open after the tool ran:
Use the Explore view to query Claude’s spans.
All spans of one session. A session can be spread over several traces, for example when you send a later message from a new request:
SELECT start_timestamp, span_name, duration
FROM records
WHERE attributes->>'anthropic.session.id' = 'sesn_...'
ORDER BY start_timestamp
One request. Each response has a request-id header. Find its spans with:
SELECT trace_id, span_name, service_name
FROM records
WHERE attributes->>'anthropic.request.id' = 'req_...'
Token usage. The same tokens are recorded on more than one span of a request: on your app’s span, on Claude’s request span, and on the model call. To count each token once in SQL, add up only the model calls, context compactions, and (for Managed Agents) outcome evaluations:
SELECT
  trace_id,
  sum((attributes->>'gen_ai.usage.input_tokens')::int) AS input_tokens,
  sum((attributes->>'gen_ai.usage.output_tokens')::int) AS output_tokens
FROM records
WHERE span_name IN ('anthropic.model_request', 'anthropic.compaction', 'anthropic.session.outcome_evaluation')
GROUP BY trace_id
| Problem | Fix |
|---|---|
| No Add destination button | Clear the Workspace filter at the top of the page with its ×. The button only shows when no workspace is selected. Also check that you have the admin role. |
| Delivery shows Failing (401 or 403) | The write token is wrong. Paste a valid token for this project, without Bearer. |
| Delivery shows Failing (404) | The endpoint has a path. Use only https://logfire-us.pydantic.dev or https://logfire-eu.pydantic.dev. |
| Delivery shows Disabled | Anthropic turns a destination off after 24 hours of failed deliveries. Fix the cause, then click Enable in its ⋮ menu. Spans from while it was off aren’t sent later. |
| Test works but your requests don’t show up | The destination doesn’t include the workspace of your API key. Check its Workspaces. |
| Claude’s spans aren’t inside your app’s traces | Call logfire.configure() before creating the client, and make calls inside a span. |
| No prompts or responses | The destination is set to Metadata only. If your organization has a HIPAA, FERPA, or K-12 data-handling restriction with Anthropic, Claude’s spans only contain metadata, whatever the content mode. |
| Calls through Amazon Bedrock or Google Vertex AI don’t show up | The Console export only covers the Claude Platform, including Claude Platform on AWS. For Amazon Bedrock, use the Anthropic integration. |
- Set up an alert for failed turns or slow tool calls.
- Learn more in Anthropic’s OpenTelemetry guide and the span reference, which lists every span and attribute.