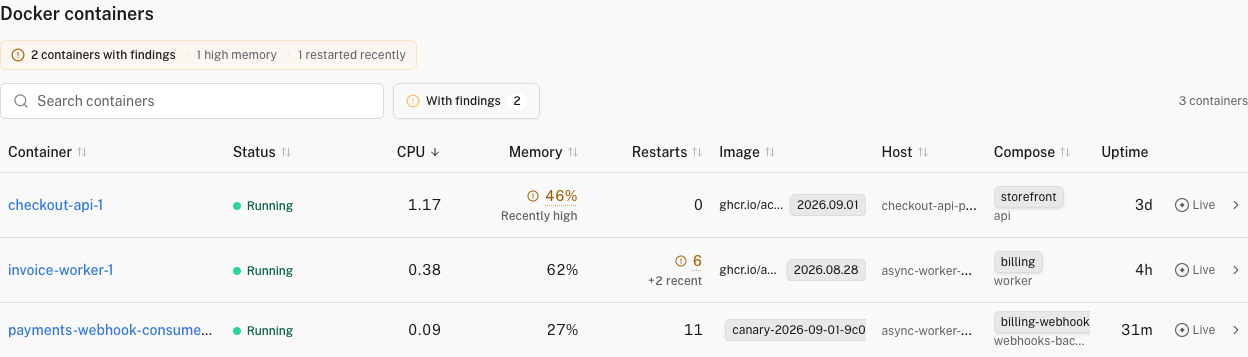
Logfire Docker view: CPU, memory, network and block I/O per container
The Docker view shows every Docker container reporting stats to your project (CPU, memory, network and block I/O) alongside the application traces those containers produced. The same stats are folded four ways: by container, image, Compose project, and host.
You’ll find Docker in the project sidebar under Infrastructure, after Kubernetes.
What’s in the view
Four lenses on the same container stats, all sortable:
Containers: one row per container, with:
Status: Running when the optional container.uptime metric reported a positive value during the selected range, or Unknown when that metric was not reported. See Setting up to enable it.
Image it’s running.
Host it runs on: links to the Hosts view when that host also reports host metrics.
CPU utilization (0–100%) with an inline sparkline.
Memory percent.
Uptime and Restarts (optional columns; see Setting up).
Images: containers folded up by image, so you can see how many containers an image is running and their aggregate load.
Compose projects: containers grouped by their Docker Compose project and service.
Hosts: containers grouped by Docker host, with links to the Hosts view when the host also reports host metrics.
Summary cards across the top show container, image, Compose-project, and host counts, plus mean processor and memory use.
Find containers that need attention
The Containers tab summarizes recent findings. Select With findings to show only affected containers:
High memory: at least three readings spanning 2 minutes stayed at or above 90% memory usage.
Restarted recently: the container’s restart counter increased during the final 15 minutes of the selected range. Logfire needs at least two readings to detect an increase.
Restart findings require the optional container.restarts metric described below. Findings cover the containers loaded into the inventory. A missing metric means Logfire cannot evaluate that condition, not that the container is healthy.
Container detail page
Click a container to open its detail page, with trend charts for:
CPU
Memory: usage against the container’s limit.
Network: split by direction (received vs transmitted), not collapsed into a total.
Block I/O: disk reads vs writes for the container.
Setting up
Containers populate from the standard OpenTelemetry docker_stats receiver. It works on its defaults: no proprietary agent, no per-container config. Add it to the collector you already run for traces, or start a new one:
receivers:
  docker_stats:
    collection_interval: 60s
    container_labels_to_metric_labels:   # so the Compose projects tab can group containers
      com.docker.compose.project: compose.project
      com.docker.compose.service: compose.service

processors:
  resourcedetection:
    detectors: [docker]   # names the host from the Docker daemon

exporters:
  otlphttp/logfire:
    endpoint: https://logfire-us.pydantic.dev   # or https://logfire-eu.pydantic.dev
    headers:
      Authorization: ${env:LOGFIRE_TOKEN}

service:
  pipelines:
    metrics:
      receivers: [docker_stats]
      processors: [resourcedetection]
      exporters: [otlphttp/logfire]
The receiver reads the local Docker socket (unix:///var/run/docker.sock by default) and negotiates the API version automatically; the collector’s user just needs permission to read that socket: the docker group, or root. The resourcedetection processor’s docker detector reads the host name from that same daemon, so the containers group under their host and link across to the Hosts view. CPU, memory, network and block-I/O land within a minute or two. For production hardening (memory limiter, batching) see the OpenTelemetry Collector Overview.
The container_labels_to_metric_labels mapping is what powers the Compose projects tab: docker_stats doesn’t export container labels on its own, so it lifts Compose’s com.docker.compose.project/service labels into the compose.project/compose.service attributes the view groups on.
Control metric volume
Keep collection_interval: 60s unless you have a specific need for finer resolution. The receiver defaults to 10 seconds, so setting 60 seconds sends one-sixth as many datapoints while still giving the Docker view a useful operational resolution.
Metric volume scales with the number of containers. Network metrics also split by interface, and block I/O metrics split by device and operation. Leave optional metrics off unless you use them, especially container.cpu.usage.percpu, which adds a separate value for every CPU core reported for every container on control groups version 1 (cgroups v1). Use excluded_images to omit short-lived or irrelevant containers by image, and only promote container labels that you actually group or filter by.
Optional extras
Uptime and Restarts columns are off by default. Enable them under the receiver:
Running the collector as a container: use the -contrib image (docker_stats isn’t in the core one), bind-mount the socket in, and run as a user that can read it:
Terminal
For a self-hosted or local-dev Logfire on localhost / LAN, reach it over host.docker.internal (add extra_hosts: ["host.docker.internal:host-gateway"]), since inside the container localhost is the collector itself. Mounting the Docker socket gives the collector root-equivalent control of the host, so treat it as a privileged mount.
Troubleshooting
Symptom
Likely cause
No containers appear
The collector can’t read the socket, or nothing is exporting yet. Confirm the socket is readable and add a debug exporter to watch metrics in the logs. The otlphttp exporter logs only on failure, so “success” is data showing up in Logfire, not a 2xx line.
Uptime and Restarts columns are empty
Those two metrics are off by default. Enable container.uptime and container.restarts under the receiver’s metrics: block.
api version is too old at startup
An older collector build isn’t auto-negotiating. Pin api_version: "1.44" (a quoted string) on the receiver.
Containerised collector can’t reach a local Logfire
Inside the container localhost is the collector itself. For a self-hosted or local-dev Logfire, reach the host via host.docker.internal (add extra_hosts: ["host.docker.internal:host-gateway"]). A public-cloud Logfire URL needs no change.