Instrument MCP: trace calls between client and server
See the calls flowing between your Model Context Protocol (MCP) client and server (the tool a client asked for, the arguments it sent, and the result the server returned) joined into one trace (the full journey of one request or agent run, made of nested spans, where each span is one unit of work with a name, a start, and a duration) in Logfire, even though the client and server run in separate processes.
The Model Context Protocol is a standard way for an AI application to call tools and fetch data from a separate server. Instrumenting both sides lets Logfire stitch their spans into a single distributed trace: one trace that spans more than one process.
- Each client request and each server response as spans, joined into one trace across both processes
- The tool the client called, with the arguments it sent and the result it got back
- The duration of each call and any errors raised on either side
You’ll need a Logfire project. Open Add data in your project (top navigation) and follow the
setup for your language: it signs your machine in with logfire auth (a browser sign-in, no token
to copy) and, for production or other languages, creates a write token (the credential your app
uses to send data). New to Logfire? Start with Getting Started.
The client example below calls OpenAI using your own API key, so running it costs money on that OpenAI account.
Install logfire:
pip install logfire
uv add logfire
conda install -c conda-forge logfire
The example below also needs the MCP SDK and a client. Install them with:
pip install 'mcp<2' 'pydantic-ai-slim[mcp,openai]'
With version 1 of the MCP SDK, call logfire.configure(), then logfire.instrument_mcp(). This works on both the client and server side. Calling it in both processes is recommended, so the spans join into one distributed trace. With version 2 of the SDK, or fastmcp 4, logfire.configure() alone is enough: see MCP SDK version 2 and fastmcp 4 below.
The example below uses Pydantic AI as the client (any MCP client works) and OpenAI as the model. To use a different provider, replace openai:gpt-4o in the client script with another model name Pydantic AI supports.
First, run the server script:
from mcp.server.fastmcp import FastMCP

import logfire

logfire.configure(service_name='server')
logfire.instrument_mcp()

app = FastMCP()


@app.tool()
def add(a: int, b: int) -> int:
    logfire.info(f'Calculating {a} + {b}')
    return a + b


app.run(transport='streamable-http')
Then run this client script in another terminal:
from pydantic_ai import Agent
from pydantic_ai.mcp import MCPToolset

import logfire

logfire.configure(service_name='agent')
logfire.instrument_pydantic_ai()  # (1)
logfire.instrument_mcp()

mcp_toolset = MCPToolset('http://localhost:8000/mcp')
agent = Agent('openai:gpt-4o', toolsets=[mcp_toolset])
result = agent.run_sync('What is 7 plus 5?')
print(result.output)
Instrumenting Pydantic AI is optional, but adds more context to the trace.
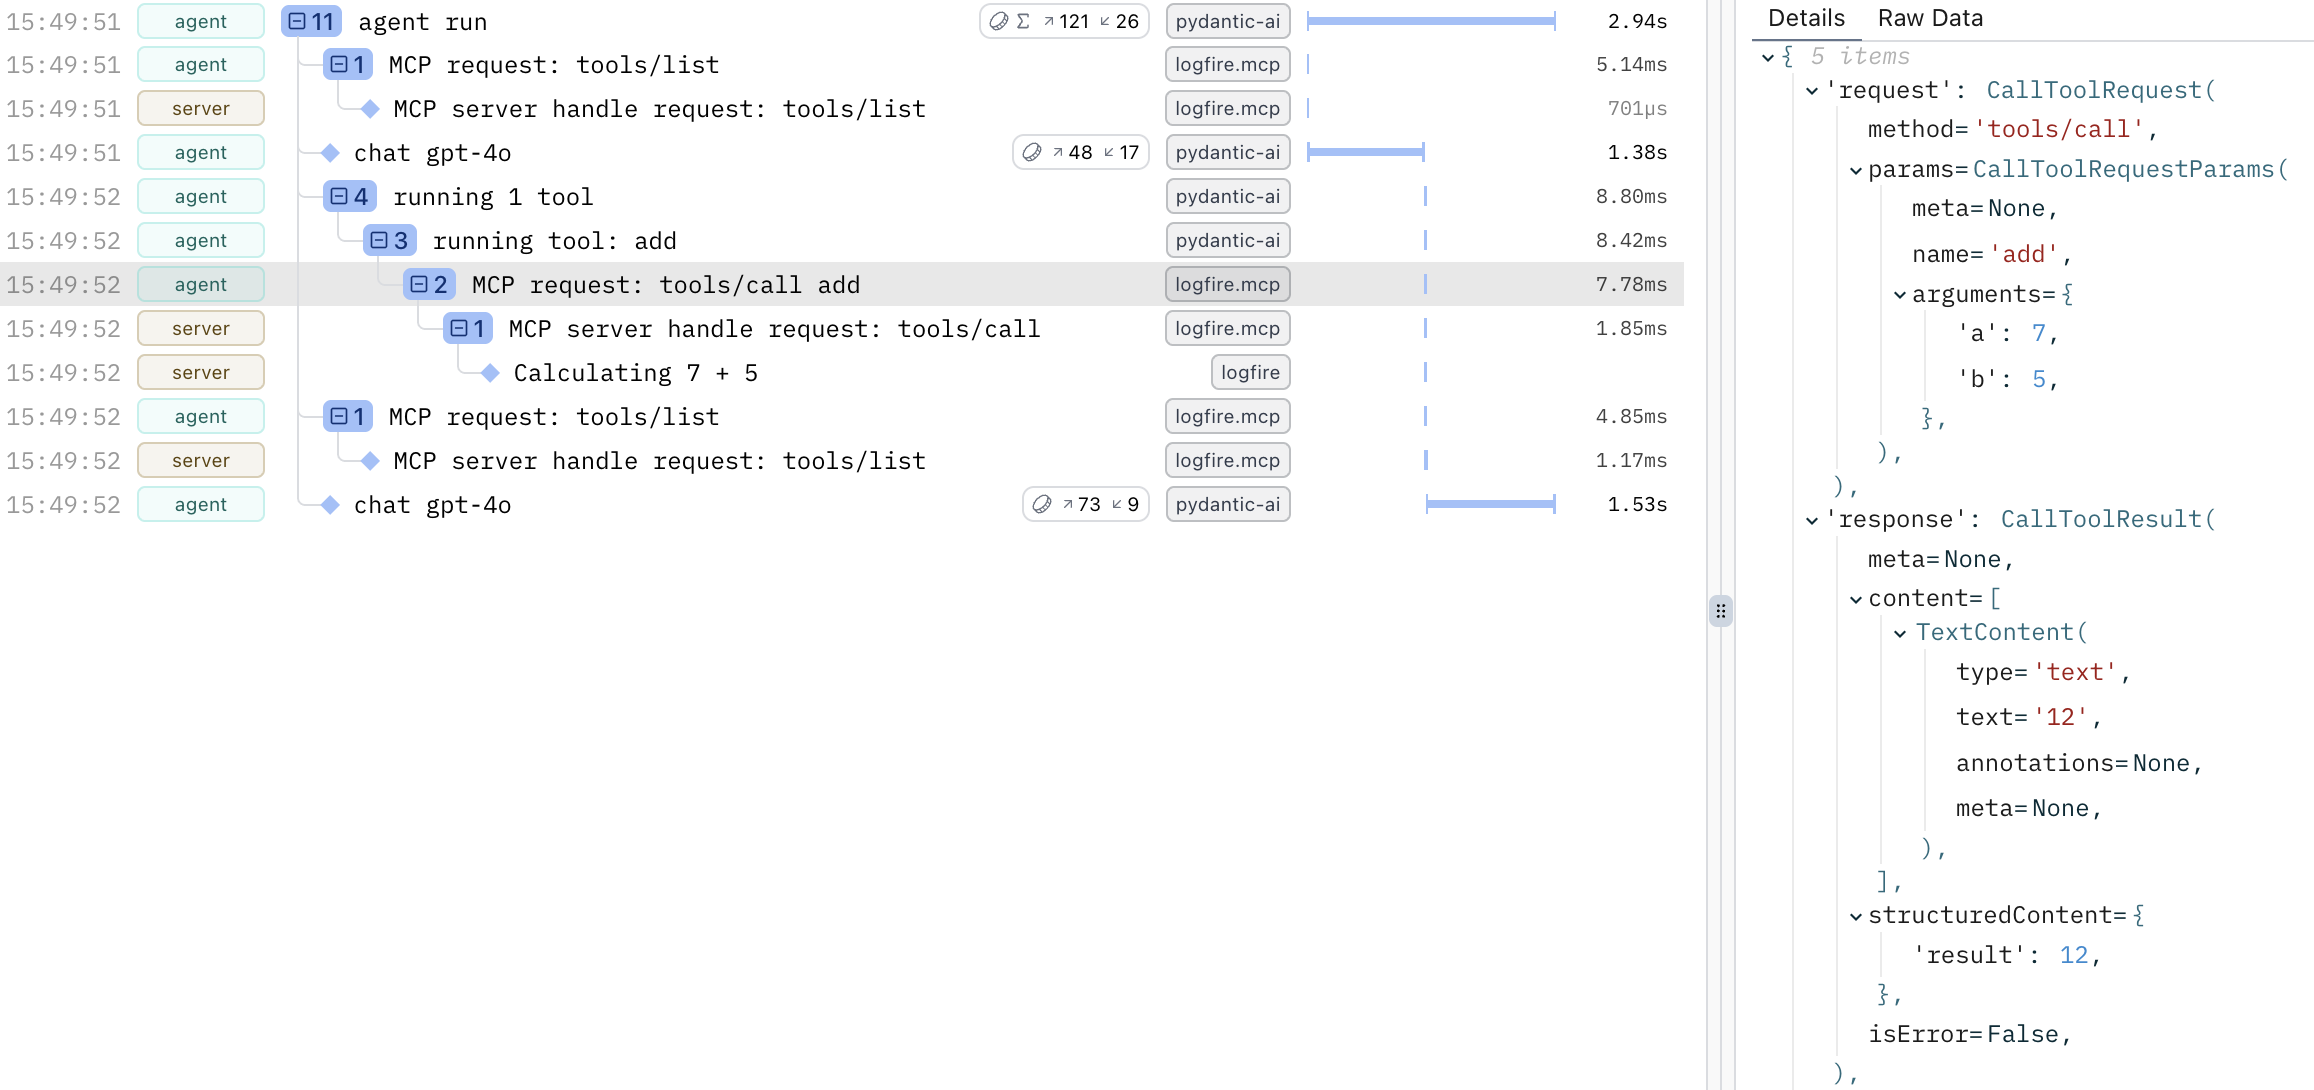
With both scripts running, open the Live view. Within a few seconds you’ll see one trace covering the client request and the server’s response to it. Click into it to see the add tool call, its arguments, and the result.
Version 2 of the MCP Python SDK (mcp>=2, which fastmcp 4 depends on) emits OpenTelemetry spans and passes the trace context between client and server on its own. With it, logfire.configure() is all you need on each side, and you get the same joined trace without calling logfire.instrument_mcp(). Calling it anyway does nothing except emit a warning saying it’s unnecessary.
The examples on this page target version 1 of the SDK, which is why the install command above pins mcp<2: mcp.server.fastmcp no longer exists in version 2, where the same server class is mcp.server.mcpserver.MCPServer.
Not seeing data? Check that logfire.configure() ran in each process and that your write token is set. With version 1 of the SDK, also check that instrument_mcp() ran after logfire.configure(), exactly once per process. Only seeing one side of the trace? Make sure both the client and the server are set up as above.
- API reference:
logfire.instrument_mcp() - MCP Python SDK