Core concepts: traces, spans, metrics, and logs
Observability is the practice of understanding what your running software is doing from the outside, from the data it emits. That data is called telemetry. Logfire is built on four kinds of telemetry that work together: spans and traces show you what happened and how long it took, metrics reveal trends over time, and logs capture individual events. This page explains each one.
New to observability? The OpenTelemetry primer is another good introduction.
| Concept | What it is |
|---|---|
| Span | One unit of work: a single operation, with a name, a start, and a duration |
| Trace | A tree of spans showing the parent/child path of one request |
| Metric | A value measured over time, such as latency, CPU load, or queue length |
| Log | A timestamped record of a single event, with no duration |
A span records one unit of work: a single operation, with a name, a start, and a duration (for example, “count the files in this directory” or “read this file”). Spans are the building block of a trace, and each one appears as a single row in the Live view.
If you’ve used logging before, think of a span as a log with a duration and structure: as well as recording that something happened, it measures how long that something took, and it can contain other spans nested inside it.

A trace is a tree of spans that shows the path of one request (a client request, an LLM run, an API call) through your application.
Spans are ordered and nested: a span can contain other spans, so a trace reads like an outline of everything that happened, in order, with each step’s duration. It shows the whole history of the services touched and the responses returned.
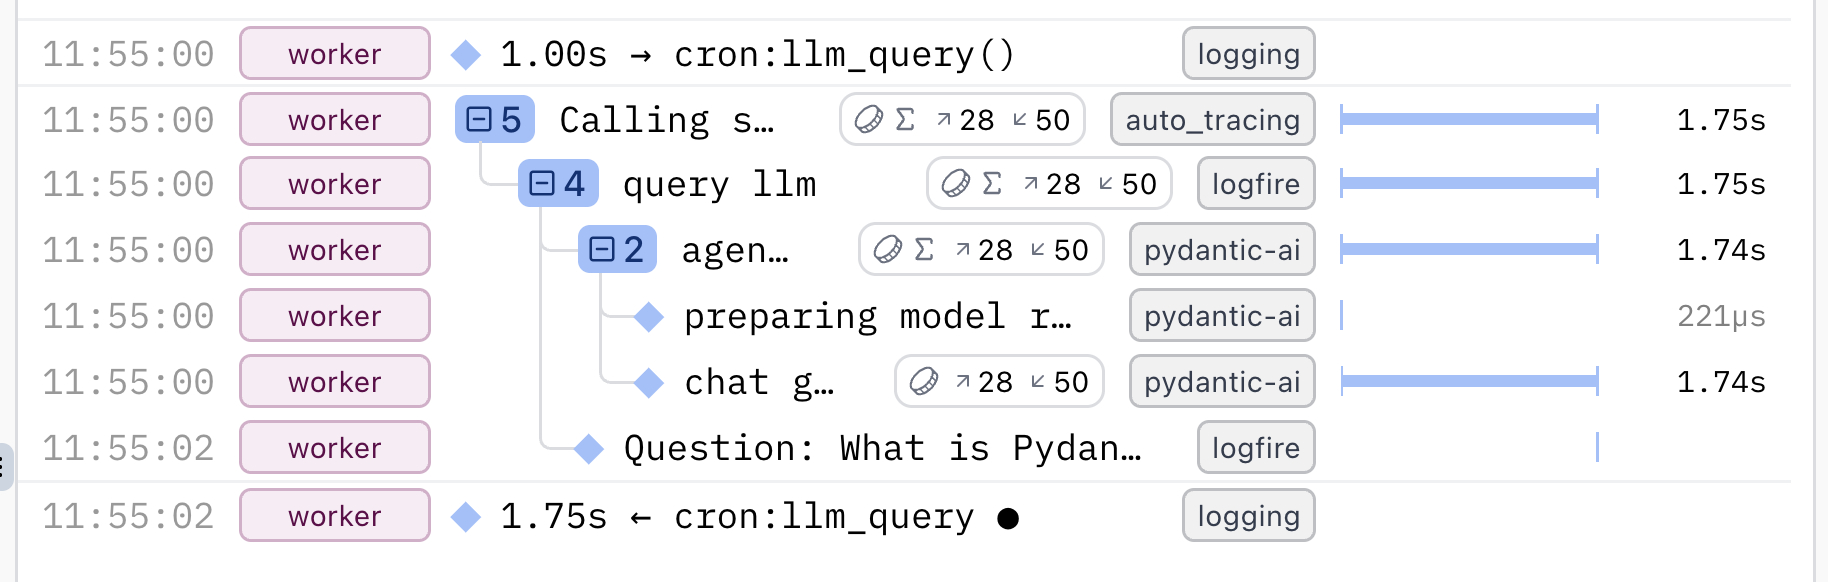
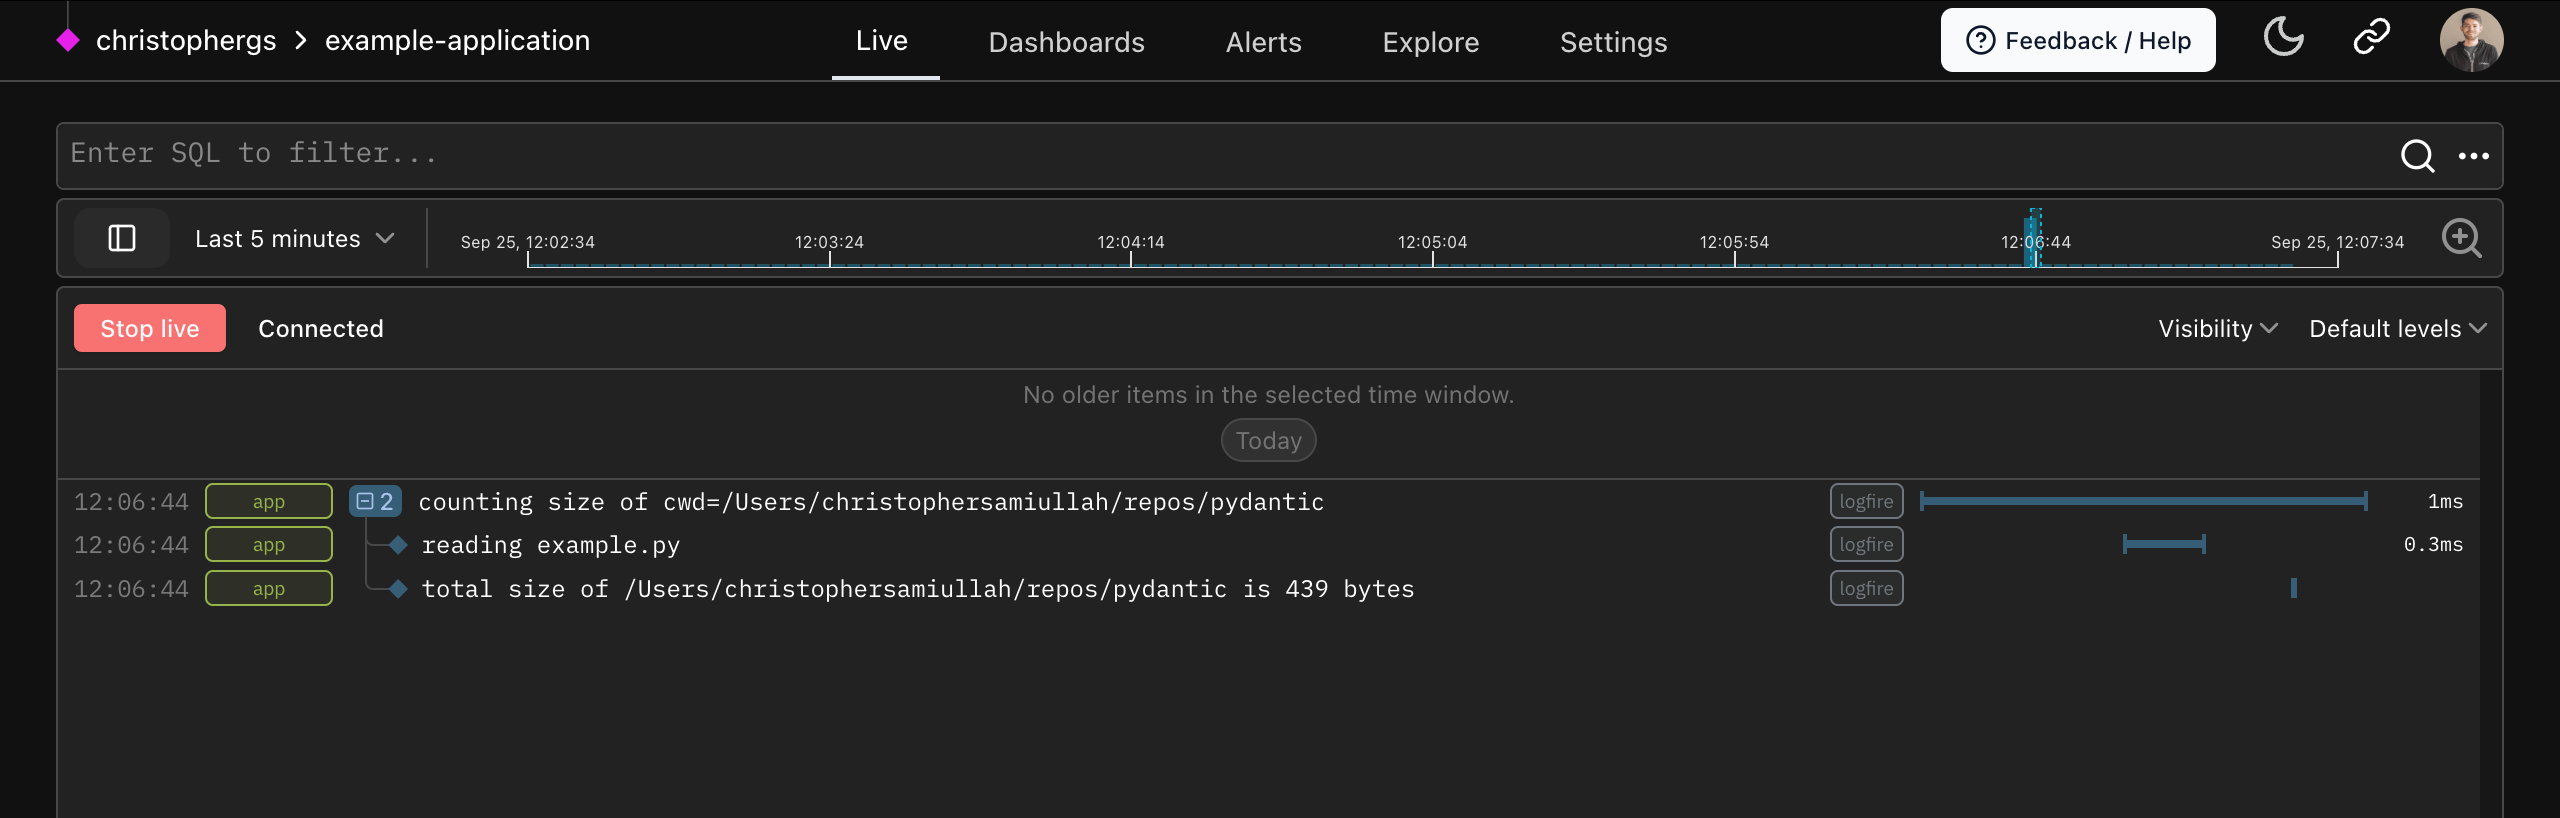
In this example:
- The outer span measures the time to count the total size of files in the current directory (
cwd). - Inner spans measure the time to read each individual file.
- Finally, the total size is logged.
from pathlib import Path

import logfire

logfire.configure()

cwd = Path.cwd()
total_size = 0

with logfire.span('counting size of {cwd=}', cwd=cwd):
    for path in cwd.iterdir():
        if path.is_file():
            with logfire.span('reading {path}', path=path.relative_to(cwd)):
                total_size += len(path.read_bytes())

    logfire.info('total size of {cwd} is {size} bytes', cwd=cwd, size=total_size)
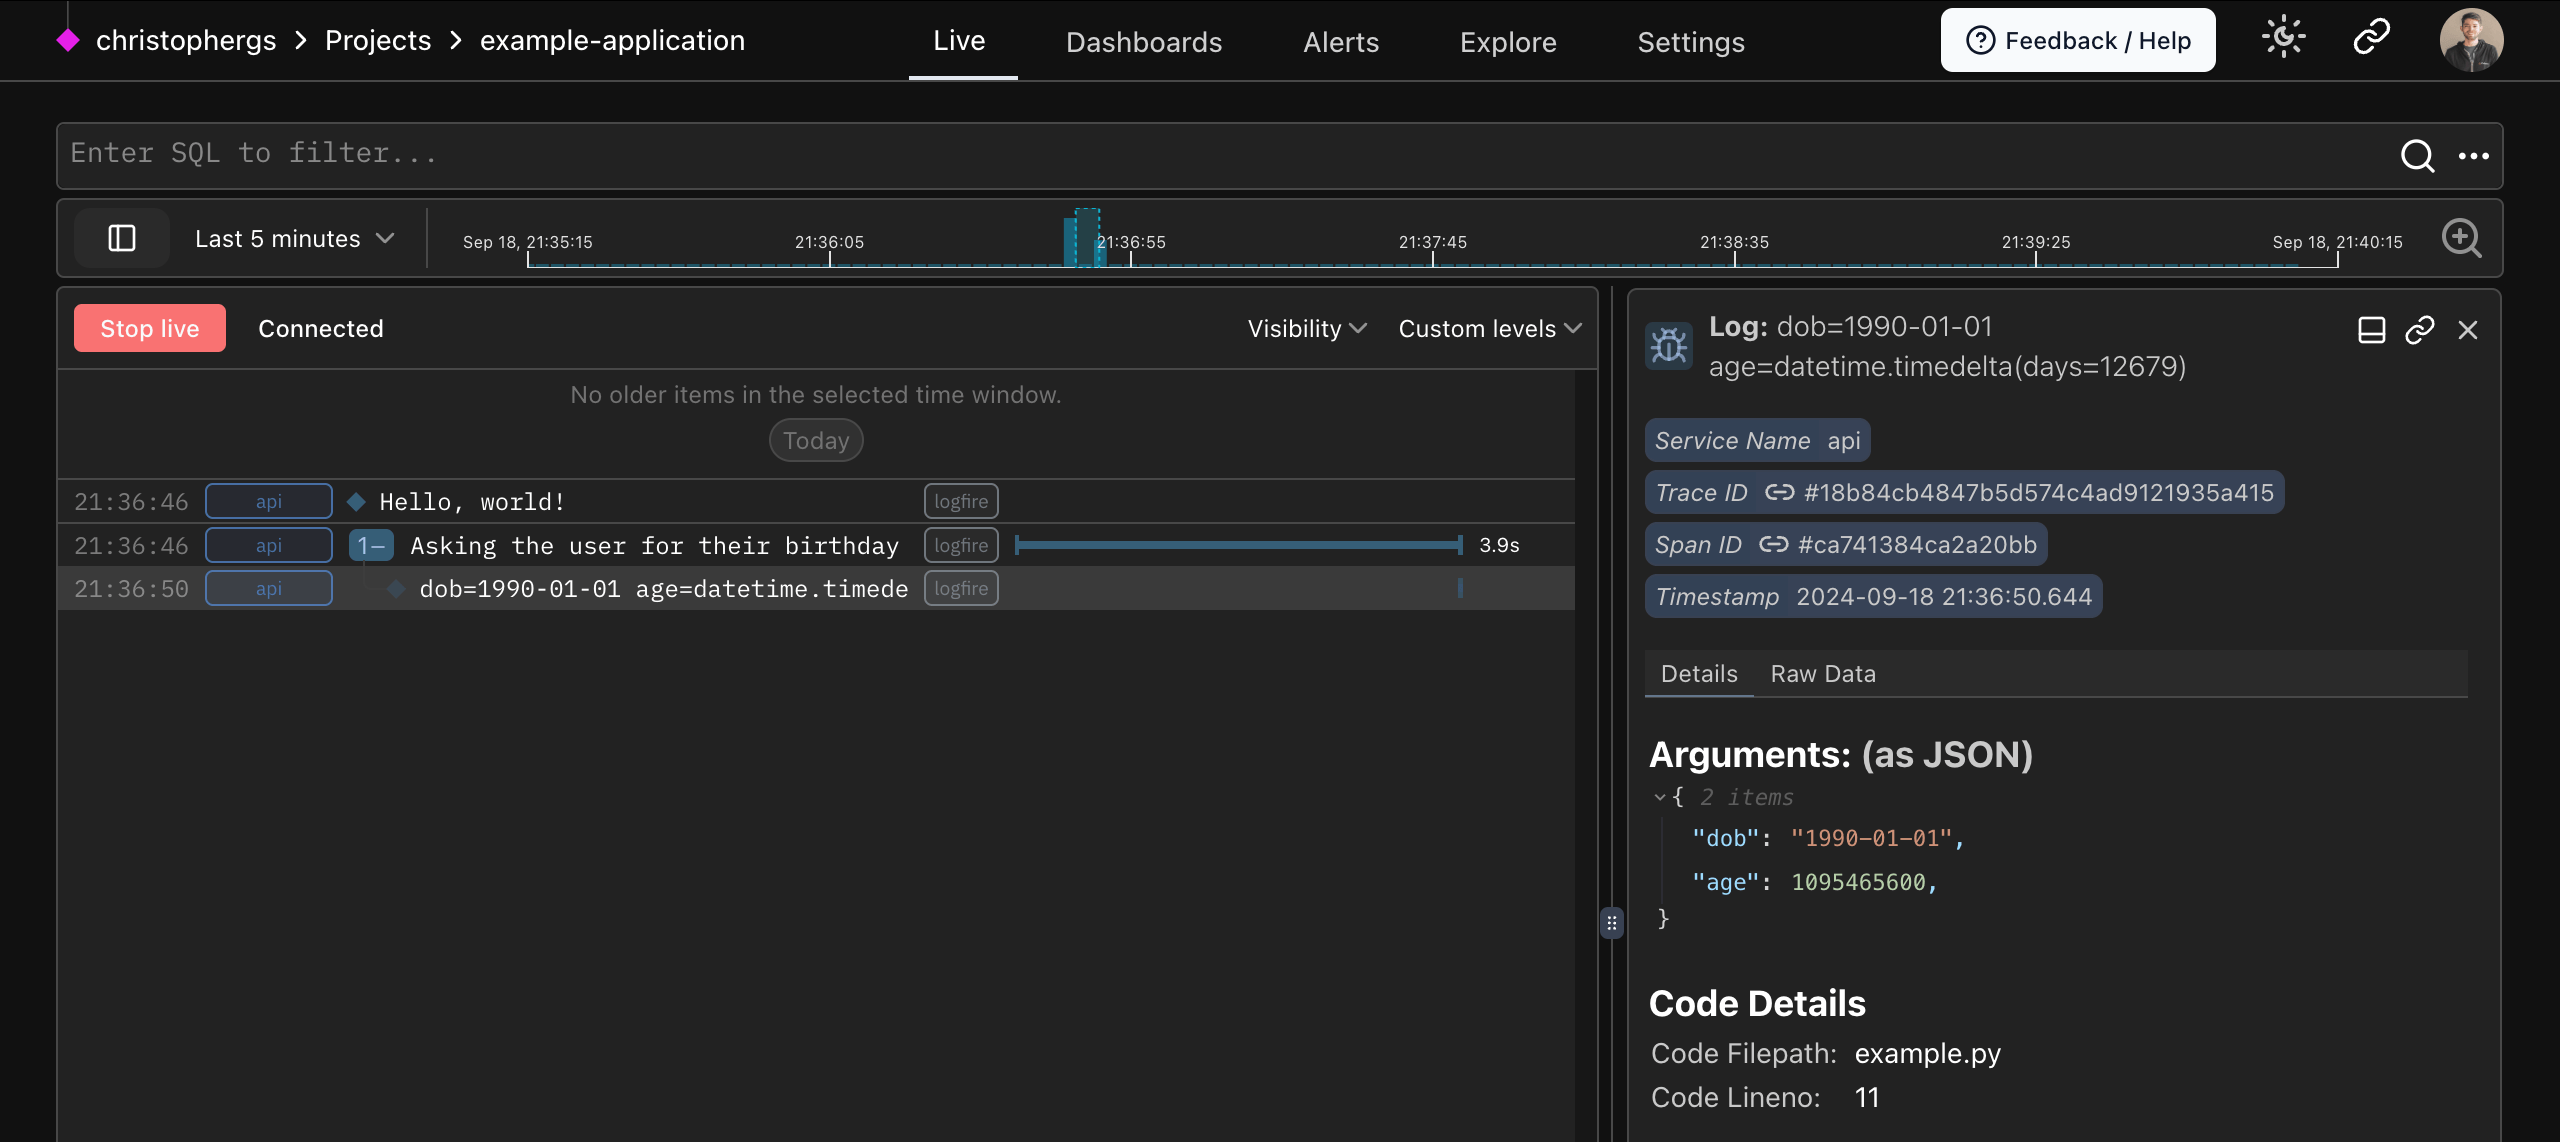
In this example:
- The outer span sets the topic: the user’s birthday
- The user input is captured in the terminal
dob(date of birth) is displayed in the span. Logfire calculates the age from thedoband displays age in the debug message
from datetime import date

import logfire

logfire.configure()

with logfire.span('Asking the user for their {question}', question='birthday'):  # (1)
    user_input = input('When were you born [YYYY-mm-dd]? ')
    dob = date.fromisoformat(user_input)  # (2)
    logfire.debug('{dob=} {age=!r}', dob=dob, age=date.today() - dob)  # (3)
Spans allow you to nest other Logfire calls, and also to measure how long code takes to run. They are the fundamental building block of traces!
Attempt to extract a date from the user input. If any exception is raised, the outer span will include the details of the exception.
This will log for example dob=2000-01-01 age=datetime.timedelta(days=8838) with debug level.
By instrumenting your code (adding a few lines so Logfire can record what it does) with traces and spans, you can see how long operations take, identify bottlenecks, and get a high-level view of request flows in your system: all invaluable for maintaining the performance and reliability of your applications.
A metric is a calculated value measuring your application through time.
- Metrics are collected at regular intervals, such as request latency, CPU load, or queue length
- Metrics are aggregated over time
- Metrics make it easy to chart long‑term trends, establish Service‑Level Objectives (SLOs), and trigger alerts when your system drifts outside acceptable thresholds
Alongside logs and traces, metrics complete the “three pillars” of observability, giving you a continuous, low‑overhead signal about the overall health and performance of your services.
import time

import logfire

logfire.configure()

# Create the histogram metric once at import time
request_duration = logfire.metric_histogram(
    'request_duration',
    unit='ms',  # milliseconds
    description='Duration of HTTP requests',
)


def handle_request():
    start = time.perf_counter()
    # … handle the request …
    duration_ms = (time.perf_counter() - start) * 1000
    # Record the observed latency
    request_duration.record(duration_ms)
Each call to request_duration.record() adds a sample to the histogram. On the backend you can visualise
p50/p95 latency, set SLOs, and trigger alerts whenever performance degrades. For more metrics examples
see the adding metrics guide.
Logs record something which happened in your application. Importantly, they do not have a duration, compared to spans and traces.
A log is a timestamped text record, either structured (recommended) or unstructured, with optional metadata. Of all telemetry signals, logs are the best known: most programming languages have built-in logging, and most Python users are familiar with the standard-library logging module, for example.
- Send your first trace: the quickstart gets you from install to a trace in about five minutes.
- Instrument a framework: Integrations record traces from FastAPI, Django, SQLAlchemy, HTTPX, and many more with one line each.
- Read your traces: the Live view is where traces arrive and where you explore them.