Services
The Services view is the entry point for finding the service you want to investigate. Each service that ships spans to your project appears as one row, sorted by whatever metric matters right now (requests, error rate, latency). Click a row to drill into its detail page, click a recent failed trace, and you land in the Live View with the failing trace open.
You’ll find Services in the project sidebar, between SQL Workbench and Hosts.
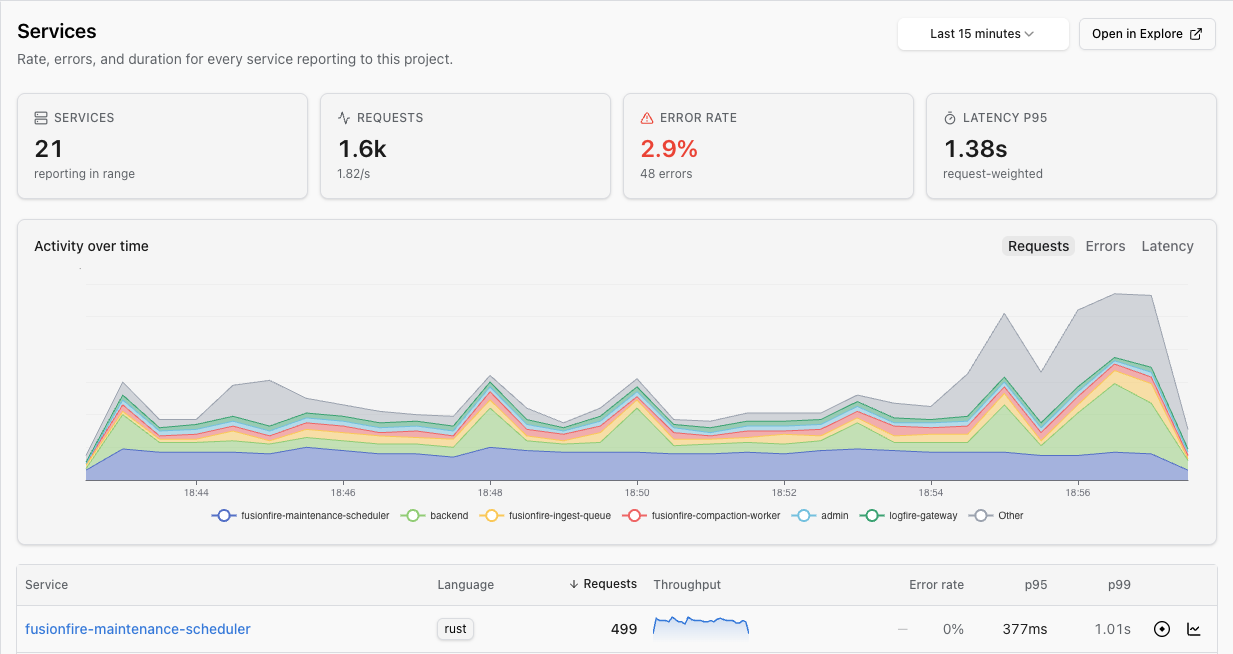
The inventory shows summary cards (services in range, total requests, error rate, p95 latency), an Activity over time chart with a Requests / Errors / Latency toggle, and one row per service with:
- Language (detected from
telemetry.sdk.language) - Requests in the current window
- Throughput sparkline
- Error rate
- p95 / p99 latency
Sort by any column. The time picker is shared with the rest of the observability surfaces.
Click a row to open the service detail page.
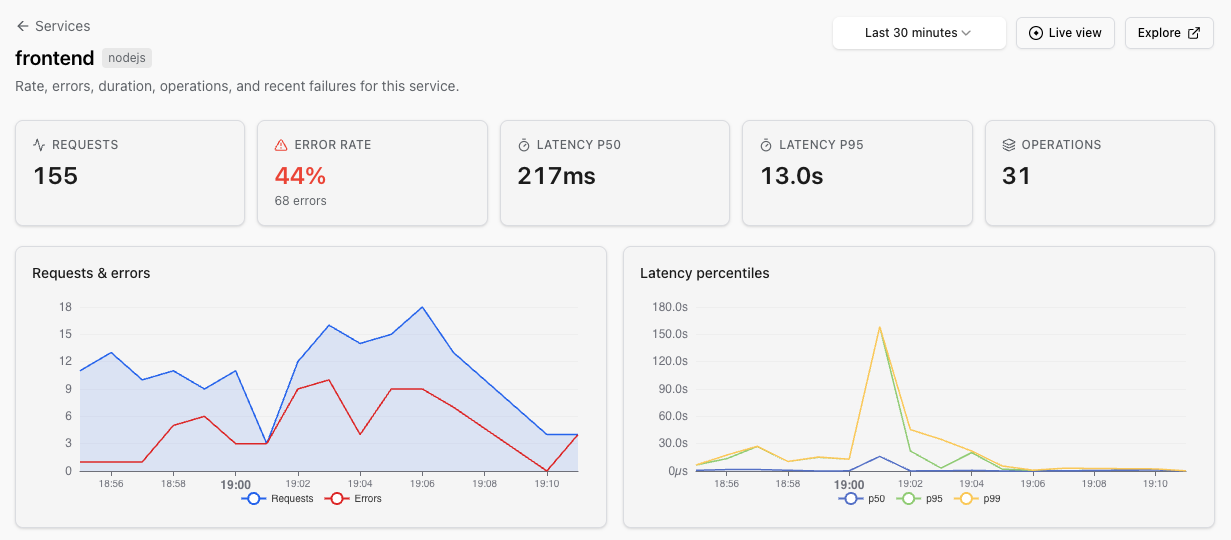
You’ll see:
- Headline cards for the service’s requests, error rate, latency p50, latency p95, and operation count.
- Side-by-side trend charts for requests and errors and for latency percentiles (p50, p95, p99), with deployment markers so you can see whether a spike lines up with a release.
- A Service topology panel showing cross-service calls in the current window, with the service you opened highlighted.
- Top operations: the highest-traffic and slowest spans inside the service.
- Recent errors: a short list of failed traces, each linking straight to the Live View so you can investigate.
Two buttons in the header (Live view and SQL Workbench) hand the whole service off to the live view or SQL Workbench in one click. The detail page defaults to the last 30 minutes.
The topology graph and the operations / errors tables below the trends:
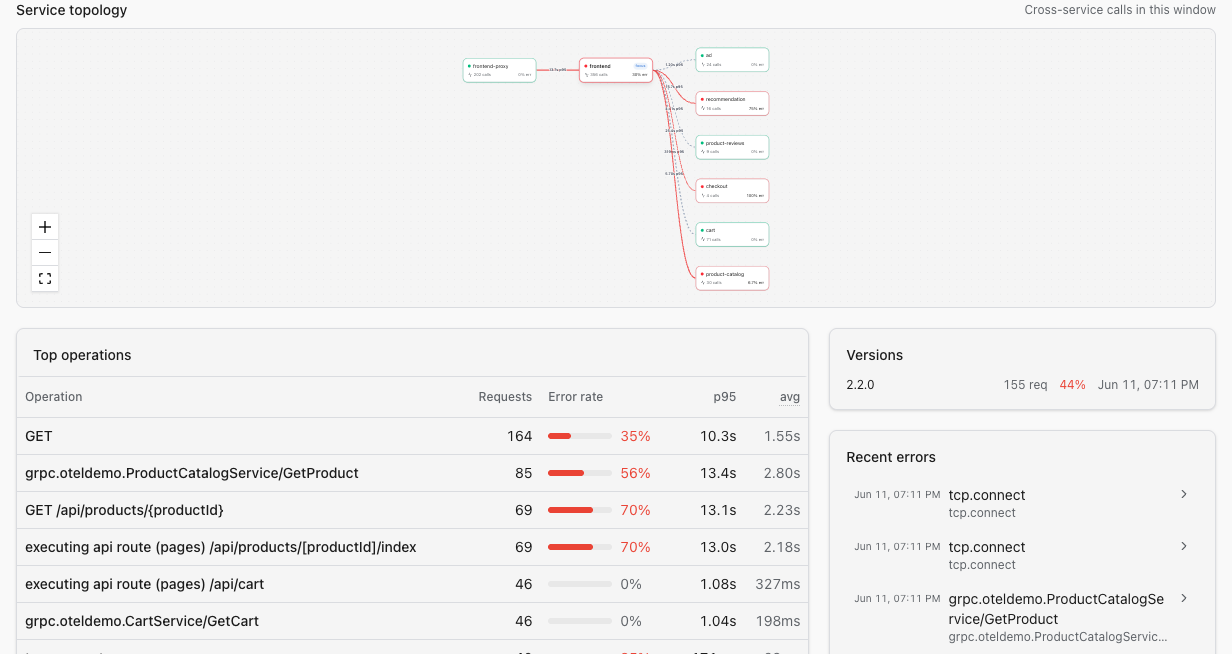
The topology graph is drawn from spans that cross service boundaries. Each node is a service; each edge represents real calls between them in the current window. Nodes are colored by error rate so a bleeding dependency is visible at a glance.
Click any node to jump to that service’s detail page. Click any recent failed trace from the panel below to land on the trace itself in the Live View.
Logfire identifies a service from the OpenTelemetry service.name resource attribute on the spans you send. If you instrument your application with the Python SDK, the TypeScript SDK, or any OpenTelemetry-compatible instrumentation, service.name is set for you. The Services view picks up new services within a minute or two of their first span.
The RED counts are computed from service entry spans: the trace roots (parent_span_id IS NULL) plus any span whose parent’s service.name differs from the span’s own. (service_name is the column name on Logfire’s records table; the underlying OTel resource attribute is service.name.) That gives downstream services in a call chain real counts even when they’re nested inside a longer trace, while still letting the topology graph draw edges between them.
| Attribute | What it does |
|---|---|
service.name | Required. The row in the inventory. Use the workload name (e.g. cart, payment-api), not a hostname or pod name. |
service.version | Drives the version pills on the detail page and the deployment markers on the trend charts. |
service.instance.id | Stable per replica. When the OpenTelemetry Operator’s auto-instrumentation is enabled, it defaults this to <namespace>.<pod>.<container>. |
deployment.environment.name | Lets you filter the inventory by env (the all envs picker in the breadcrumb). The older deployment.environment is honoured too. |
telemetry.sdk.language | Drives the Language column. Auto-set by every OTel SDK. |
The graph draws an edge wherever a span’s service.name differs from its parent’s service.name. The renderer reads only service.name today, so edges to external dependencies (third-party APIs, managed databases) are labelled with the calling service’s name rather than the dependency itself. Give every span-emitting component a distinct, meaningful service.name and the graph will be readable.
If your project is empty, the fastest path to a Services row is one span from the Python SDK:
pip install logfire
export LOGFIRE_TOKEN=<your write token from project Settings → Write tokens>
export OTEL_SERVICE_NAME=cart
python -c "import logfire; logfire.configure(); logfire.info('hi')"
Refresh the Services page. cart should appear within a minute or two. For broader instrumentation paths (FastAPI, Django, gRPC, OTel Collector), see the Onboarding Checklist.
| Symptom | Likely cause |
|---|---|
| Service doesn’t appear in the inventory | No service.name resource attribute on the spans, or the project hasn’t received any span yet. Both the Python and TypeScript SDKs set service.name for you; if you send raw OTLP, set it explicitly. |
The row shows under (unknown) | Same as above: service.name is the row key. |
| One service appears as two rows | service.name differs across replicas (e.g. one carries a hostname suffix). Pin it via OTEL_SERVICE_NAME or the SDK’s service_name argument so every replica reports the same string. |
| An edge between two services is missing from the topology | Either no span actually crossed that service boundary in the window, or tail sampling dropped the spans that did. The graph reads from real cross-boundary spans, not from a configured topology. |
| Counts are way lower than expected | Head or tail sampling is dropping spans before they reach Logfire. RED metrics on this page count what arrived, not what was emitted. |