Kubernetes
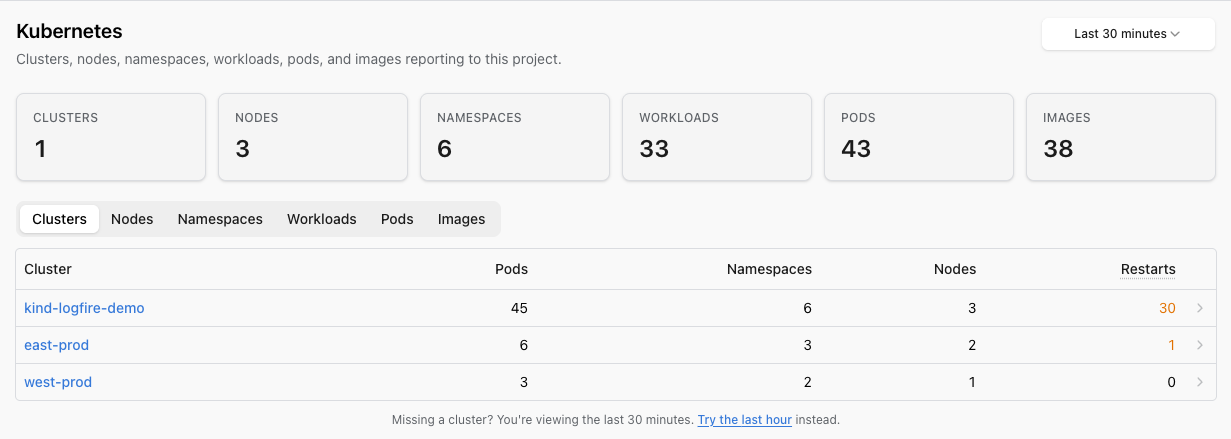
The Kubernetes view is the cluster-shaped browser for your Kubernetes telemetry. Six lenses on the same data (Clusters, Nodes, Namespaces, Workloads, Pods, and Images) are all sortable, with one-click drill-down to the traces each pod produced in the Live View.
You’ll find Kubernetes in the project sidebar, between Hosts and Metrics.
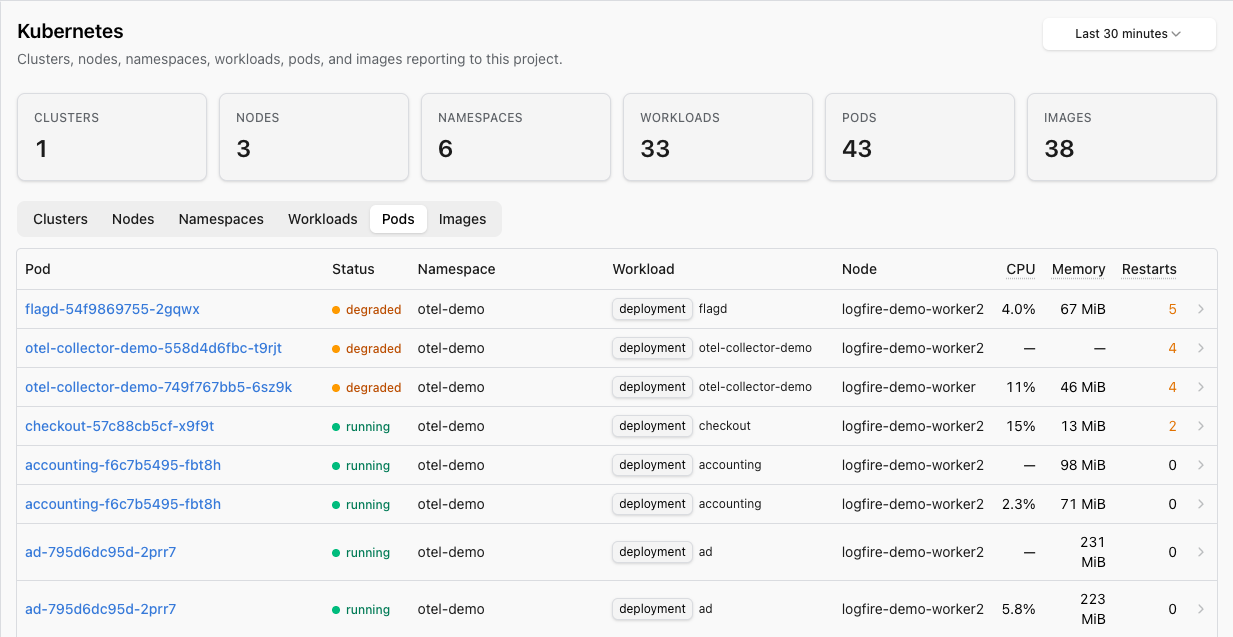
Switch to the Pods tab to drop into individual pod state: restart counts, CPU and memory per pod, status pill, and the workload they belong to:
The top of the page shows summary cards for the whole project: clusters, nodes, namespaces, workloads, pods, and unique container images.
Below the cards, six tabs let you browse by level:
| Tab | Shows |
|---|---|
| Clusters | One row per cluster, with pod / namespace / node counts and total restarts in the window. |
| Nodes | One row per node, with cluster, CPU + sparkline, memory, ready status, and pod count. |
| Namespaces | Pod count, CPU and memory usage, restart count. |
| Workloads | Workload name and kind, namespace, cluster, pod count, available-vs-desired replicas, restarts. |
| Pods | Status pill (Running / Pending / Failed / Succeeded / Unknown), restart count, CPU, memory, ready state. |
| Images | Container image digest, the workloads using it, and total deployed size. |
Restart counts roll up at every level. If a single pod is in a crash loop, you can spot it from the Clusters or Workloads tab without drilling all the way down.
The view follows the Kubernetes hierarchy you already think in:
- From a cluster to the namespaces, nodes and workloads inside it.
- From a namespace to the workloads and pods inside it.
- From a workload (Deployment, StatefulSet, DaemonSet, etc.) to its pods.
- From a pod to its workload, its namespace, its node, and the traces it produced.
Every detail page links into the Live View for the trace investigation that ends the question.
The recommended path is the upstream opentelemetry-kube-stack Helm chart. By default it deploys the OpenTelemetry Operator, a DaemonSet OpenTelemetryCollector running every preset this view reads from: kubeletMetrics (with metric_groups already set to [node, pod, container]), clusterMetrics (k8s_cluster with leader election so it only emits from one pod), hostMetrics, kubernetesAttributes (the trace-enrichment processor), and kubernetesEvents, plus the ServiceAccount, RBAC and CRDs it all needs. You just point its OTLP exporter at Logfire:
# values.yaml: Logfire-shaped overrides for opentelemetry-kube-stack.
# See the chart's own values.yaml for the full schema; this is only the
# overrides on top of the defaults.

clusterName: my-cluster   # shows up as the row label in the Clusters tab

# Inject the write token into every collector pod the chart deploys.
extraEnvs:
  - name: LOGFIRE_TOKEN
    valueFrom:
      secretKeyRef:
        name: logfire-token
        key: LOGFIRE_TOKEN

# Route the daemon collector's three pipelines to Logfire.
# Override must live under `collectors.daemon.config`. The chart's
# collector-specific config wins over `defaultCRConfig.config`.
collectors:
  daemon:
    config:
      exporters:
        otlphttp/logfire:
          endpoint: https://logfire-us.pydantic.dev   # or https://logfire-eu.pydantic.dev
          headers:
            Authorization: ${env:LOGFIRE_TOKEN}
      service:
        pipelines:
          traces:  {exporters: [otlphttp/logfire]}
          metrics: {exporters: [otlphttp/logfire]}
          logs:    {exporters: [otlphttp/logfire]}
helm repo add open-telemetry https://open-telemetry.github.io/opentelemetry-helm-charts
kubectl create namespace observability
kubectl -n observability create secret generic logfire-token \
  --from-literal=LOGFIRE_TOKEN=<your write token from project Settings → Write tokens>
helm upgrade --install otel-stack open-telemetry/opentelemetry-kube-stack \
  -n observability -f values.yaml
Data starts flowing within a minute or two of the daemon pods reaching Ready. The chart wires the k8sattributes processor into the daemon’s trace pipeline so the drill-down from a pod to the spans that pod emitted in the Live View works out of the box.
For the full per-piece breakdown (RBAC, both collector configs, the k8sattributes processor’s pod_association chain, and a kind walkthrough), see the Kubernetes monitoring how-to-guide. For an end-to-end article including a real application sending traces and unified dashboards, see Full-stack Kubernetes observability with Logfire.
If you have not set anything up yet, the empty state on each tab has a Set up button that deep-links to the relevant page of the add-data wizard.
The chart’s kubernetesEvents preset turns Kubernetes events (pod scheduling, OOMKills, image pull failures, deployment progress) into log records via the k8sobjects receiver and ships them to your project. There is no dedicated Events tab in the Kubernetes view yet. To read them, open the Live View and filter on the relevant pod, namespace or k8s.* attribute, or query the records table directly in SQL Workbench. Watch this space. An events feed in the Kubernetes view is in our backlog.
| Symptom | Likely cause |
|---|---|
Clusters tab is empty or shows pods: 0 | The cluster-scope collector (or the chart’s clusterMetrics preset) is not running, or k8s_cluster is missing from the metrics pipeline. |
| Nodes tab CPU and memory columns are blank | kubeletstats is running with the default metric_groups: [container, pod]. Add node to the list (the chart preset includes it by default). |
| Pod row has no traces to drill into | The k8sattributes processor is not on the trace pipeline, so spans never get k8s.pod.name etc. attached. The chart wires this in by default; if you assembled the setup by hand, see Kubernetes monitoring. |
| Cluster metrics appear duplicated across nodes | k8s_cluster is running on every replica without k8s_leader_elector. The chart configures the elector; from-scratch setups must add it. |
| Two clusters collide as one row in the Clusters tab | Both clusters report the same k8s.cluster.name. Set a unique clusterName on each via the chart’s top-level clusterName: value or the resource/cluster processor in a hand-rolled setup. |