Send traces from Java
See what your Java application is doing in Logfire: the requests it handles, how long each one took, and which ones failed, without changing your code. It is one flag and about two minutes.
Java does not have a dedicated Logfire SDK, but Logfire is built on OpenTelemetry (OTel), the open industry standard for collecting traces, metrics, and logs. OpenTelemetry ships a Java agent that attaches to your running application and instruments common libraries (web servers, HTTP clients, database drivers) for you. You add one flag when you start the app and get traces (the full journey of one request, made of nested spans, where a span is one unit of work with a name, a start, and a duration) in the Logfire UI.
You need:
- A Logfire project and a write token (the credential your app uses to send data to a Logfire project). Copy one from Project → Settings → Write tokens; see Create Write Tokens.
- A working Java runtime and an application you can run. The agent instruments a real app, so a program that does no work produces no spans.
1. Download the agent
curl -L -o opentelemetry-javaagent.jar \
  https://github.com/open-telemetry/opentelemetry-java-instrumentation/releases/latest/download/opentelemetry-javaagent.jar
2. Configure the agent
export OTEL_SERVICE_NAME=hello-java
export OTEL_EXPORTER_OTLP_ENDPOINT=https://logfire-us.pydantic.dev
export OTEL_EXPORTER_OTLP_HEADERS='Authorization=your-write-token'
export OTEL_EXPORTER_OTLP_PROTOCOL=http/protobuf
The endpoint above is for the US data region. If your project is in the EU region, use https://logfire-eu.pydantic.dev instead.
3. Start your app with the agent attached
java -javaagent:./opentelemetry-javaagent.jar -jar myapp.jar
Replace myapp.jar with your application’s jar, or add -javaagent:./opentelemetry-javaagent.jar to your normal start command. No code changes and no extra dependencies: the agent instruments the web server, HTTP clients, and database drivers your app already uses.
4. Exercise your app
The agent only records work your app actually does. Send it a request (open a page, call an endpoint, or run the code path you care about) so it produces spans.
Open the Live view in Logfire. Traces arrive under the service name hello-java as your app handles work:
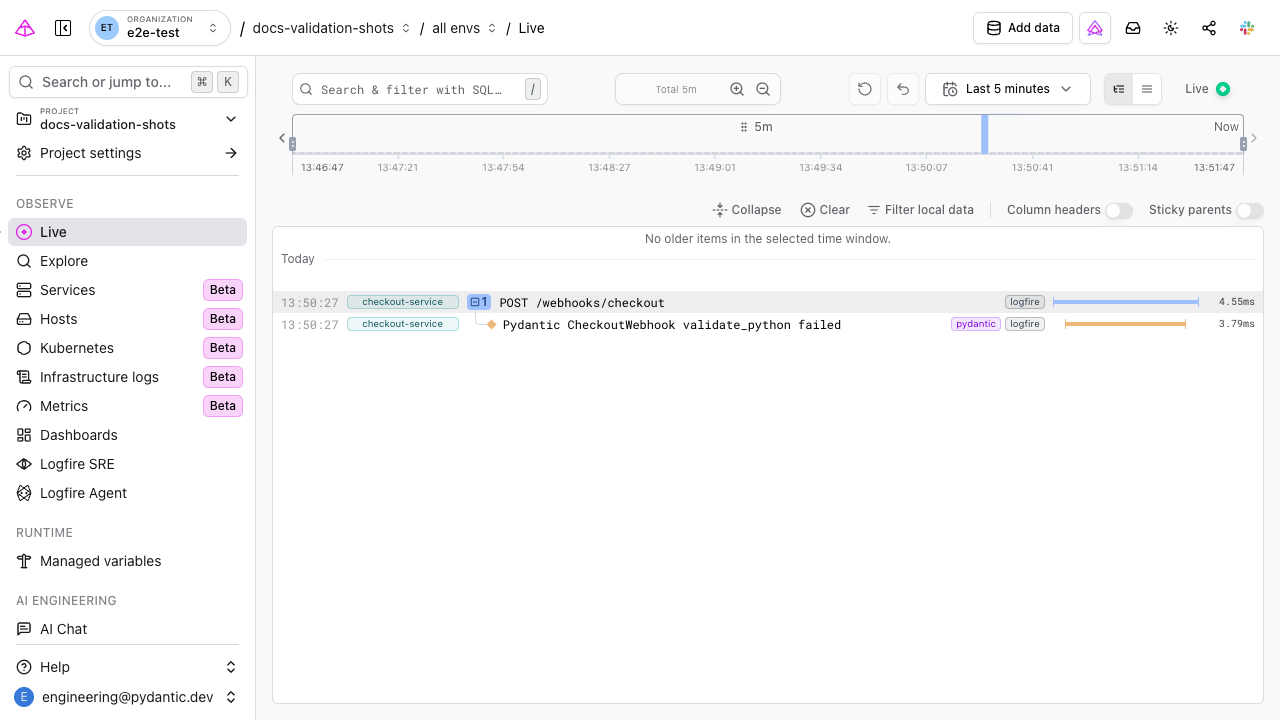
Each row is one span, with its service, name, and duration. The screenshot shows a busier app; your app’s spans appear as rows under service hello-java, which you can click to open their full traces.
| Symptom | Likely cause | Fix |
|---|---|---|
| Nothing arrives | The endpoint points at the wrong region | Confirm the endpoint matches your data region |
| No spans appear at all | The app did no instrumented work | Trigger an HTTP request or database call, or add manual instrumentation for your own code |
| Can’t tell what the agent is doing | No visibility into what it instruments | Run with -Dotel.javaagent.debug=true to log what the agent instruments and why nothing exports |
| Connection or region errors | Wrong base URL | Give the bare base URL (https://logfire-us.pydantic.dev); the agent appends /v1/traces. Check the URL matches your data region |
| Nothing arrives from a self-hosted instance with a private certificate | The JVM has its own trust store and does not trust a private CA | Point the agent at the CA: OTEL_EXPORTER_OTLP_CERTIFICATE=/path/to/ca.pem |
- New to tracing? Core concepts explains spans and traces and how to read them.
- Want to add your own spans? Use the OpenTelemetry Java API on top of the automatic ones.
- Another language? See Language support, or Alternative clients for the generic pattern.