Send traces from Ruby
See what your Ruby application is doing in Logfire: the requests it handles, how long each one took, and which ones failed. This takes about five minutes.
Ruby does not have a dedicated Logfire SDK, but Logfire is built on OpenTelemetry (OTel), the open industry standard for collecting traces, metrics, and logs. The standard OpenTelemetry Ruby SDK sends data straight to Logfire once you point it at the right endpoint, and you get traces (the full journey of one request, made of nested spans, where a span is one unit of work with a name, a start, and a duration) in the Logfire UI.
You need:
- A Logfire project and a write token (the credential your app uses to send data to a Logfire project). Copy one from Project → Settings → Write tokens; see Create Write Tokens.
- A working Ruby toolchain (Ruby 3.0 or newer).
1. Install the OpenTelemetry gems
gem install opentelemetry-sdk opentelemetry-exporter-otlp
Using Bundler? Run bundle add opentelemetry-sdk opentelemetry-exporter-otlp instead.
2. Configure the exporter
export OTEL_EXPORTER_OTLP_ENDPOINT=https://logfire-us.pydantic.dev
export OTEL_EXPORTER_OTLP_HEADERS='Authorization=your-write-token'
The endpoint above is for the US data region. If your project is in the EU region, use https://logfire-eu.pydantic.dev instead. The Ruby exporter sends over OpenTelemetry Protocol (OTLP) on HTTP, which is what Logfire accepts, so you do not set a protocol.
3. Add the code
require 'opentelemetry/sdk'
require 'opentelemetry/exporter/otlp'

# Reads OTEL_EXPORTER_OTLP_ENDPOINT and OTEL_EXPORTER_OTLP_HEADERS from the environment.
OpenTelemetry::SDK.configure do |c|
  c.service_name = 'hello-ruby'
end

tracer = OpenTelemetry.tracer_provider.tracer('hello-ruby')
tracer.in_span('Hello World') do |span|
  # your work here
end

# Flush the batch before the process exits, or the span may never be sent.
OpenTelemetry.tracer_provider.shutdown
4. Run it
ruby hello.rb
Open the Live view in Logfire. Your Hello World span appears as it arrives:
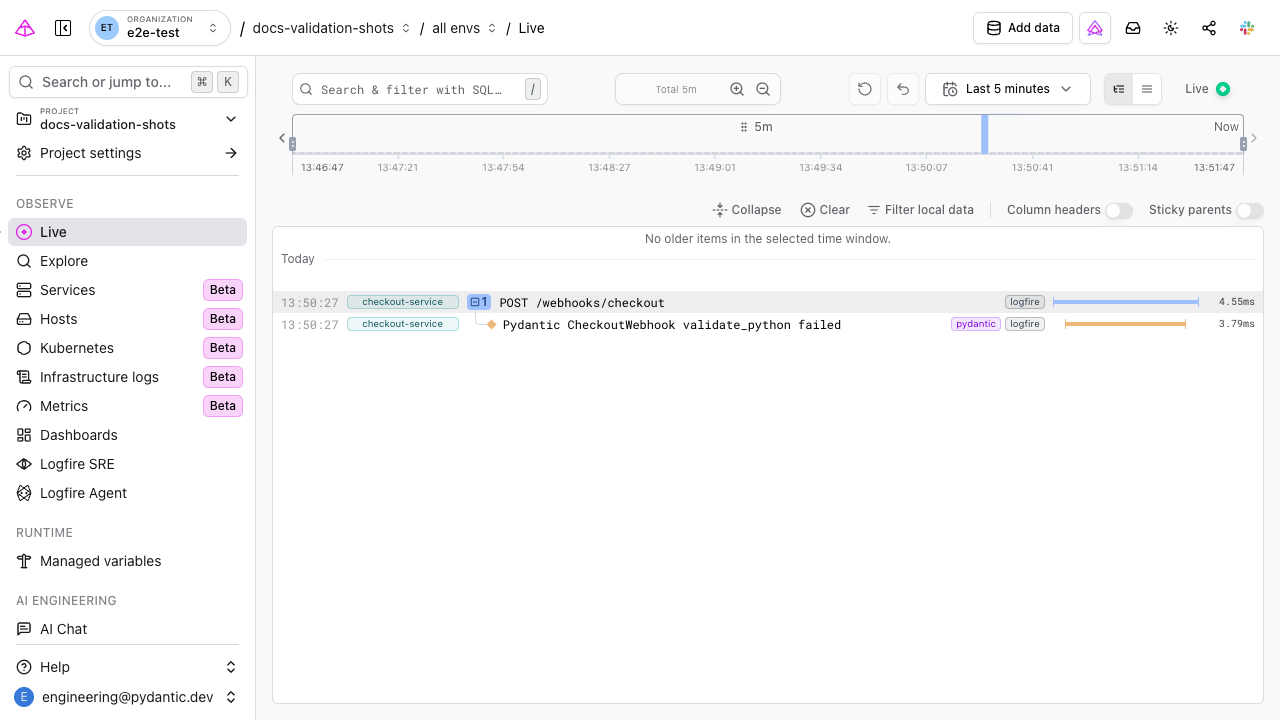
Each row is one span, with its service, name, and duration. The screenshot shows a busier app; your run appears as its own row, service hello-ruby and span Hello World, which you can click to open the full trace.
| Symptom | Likely cause | Fix |
|---|---|---|
| The script runs but nothing appears | The batch exports in the background, so a short script can exit before it flushes | Call OpenTelemetry.tracer_provider.shutdown before the process exits (as shown above) |
| Nothing appears and you see no error | The Ruby exporter is quiet on both success and failure | Set OTEL_LOG_LEVEL=debug to surface export errors (a bad token or endpoint shows as “Unable to export”) |
Spans show under unknown_service | The service name is not set | Set c.service_name in code, or OTEL_SERVICE_NAME |
| Nothing arrives from a self-hosted instance with a private certificate | Ruby does not trust the private CA | Point the exporter at the CA: OTEL_EXPORTER_OTLP_CERTIFICATE=/path/to/ca.pem |
- New to tracing? Core concepts explains spans and traces and how to read them.
- Want automatic traces? Add the
opentelemetry-instrumentation-allgem and callc.use_allinconfigureto instrument Rails, Sinatra, HTTP clients, and database drivers. - Another language? See Language support, or Alternative clients for the generic pattern.