Metrics Explorer
The Metrics explorer is built for the moment when you know a metric exists somewhere but you can’t remember what it’s called, you don’t know which labels are useful, and you don’t want to write a query yet. Three steps: pick a namespace, pick a metric, see what dimensions you can break it down by. No SQL required. The SQL is on every card when you want it.
You’ll find Metrics in the project sidebar, after Kubernetes.
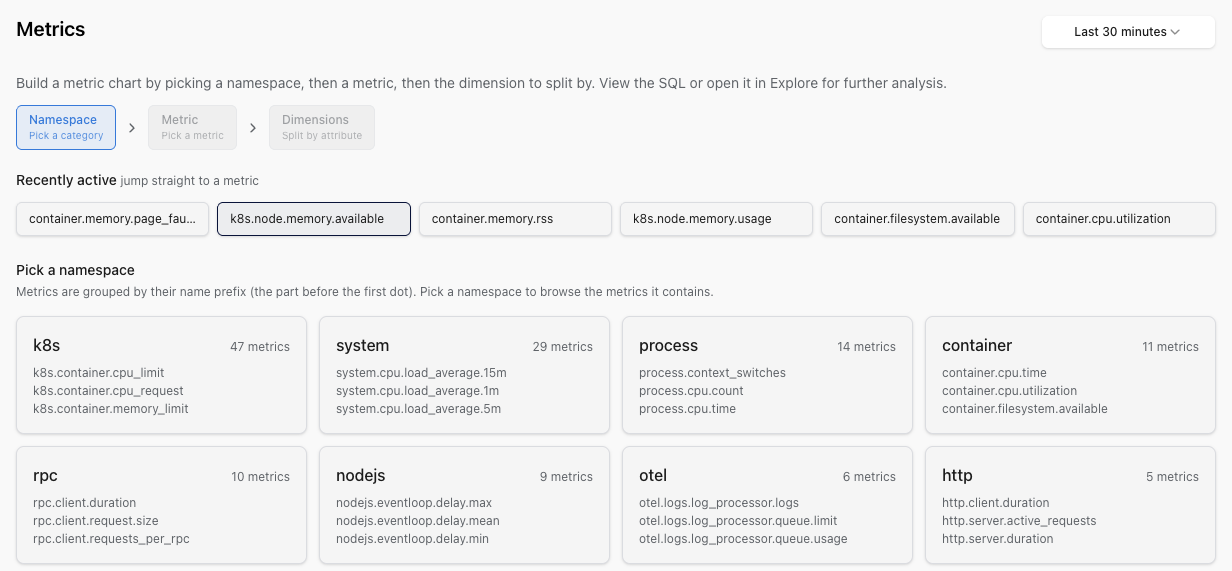
Metrics are grouped by namespace, which is the prefix before the first dot in the metric name. http.server.duration lives under http, system.cpu.utilization lives under system, k8s.pod.cpu.usage lives under k8s. Metrics whose name doesn’t follow the <namespace>.<metric> convention (usually SDK-instrumented counters from your own code) land in an Everything else section at the bottom. The grouping is structural: no metadata file or instrument list to configure.
The top of step 1 has a Recently active strip so the metrics you actually look at are one click away.
Step 2 lists the metrics inside the namespace you picked. Each entry has a sparkline of recent activity, so empty metrics are obvious before you click. Metrics that haven’t reported any data in the current window are hidden: the picker shows you what’s live now, not what stopped emitting last quarter.
Step 3 shows you a small chart per dimension (label) on the metric, with the cardinality of each dimension shown on the card. You can see what a breakdown would look like before committing to it; you can spot the high-cardinality ones that would explode if grouped on; and you can promote any dimension to the main chart with a click.
Each card has:
- View SQL: opens a dialog with the exact SQL that produced the chart. Copy it for a dashboard, or send it to a teammate.
- Open in SQL Workbench: opens SQL Workbench with that query already populated, so you can extend it.
Aggregations default sensibly by metric kind, with the rest available from the dropdown:
| Metric kind | Default aggregation | Available in the dropdown |
|---|---|---|
| Gauge | avg | avg, sum, min, max, count, p50, p95, p99 |
| Sum (counter) | sum | avg, sum, min, max, count, p50, p95, p99 |
| Histogram | avg | avg, sum, min, max, count |
| Exponential histogram | avg | avg, sum, min, max, count |
The wizard is for discovery. SQL Workbench is for the real work. The View SQL and Open in SQL Workbench buttons on every card are the on-ramp between them, so you can do as much as the wizard handles and graduate without retyping anything.
The columns you see in the wizard live on the metrics table; the full schema is in the SQL reference.
The Metrics explorer reads from the OpenTelemetry metrics you’re already sending to your Logfire project: there’s no separate metric pipeline. If you instrument your application with the Python SDK, the TypeScript SDK, or via the OpenTelemetry Collector, every metric you emit appears in the catalog within a minute or two of its first sample.
The set of automatically-collected metrics that populate the wizard usefully includes:
| Source | Namespace | Example metric |
|---|---|---|
System metrics (SDK) or hostmetricsreceiver (Collector) | system | system.cpu.utilization, system.memory.usage, system.network.io |
| Cloud metrics | varies by provider | AWS aws.*, GCP gcp.*, Azure azure.* |
| FastAPI / Django / Flask / Starlette | http | http.server.request.duration (histogram) |
| HTTP clients (HTTPX, Requests, AIOHTTP) | http | http.client.request.duration |
Kubernetes (kubeletstatsreceiver) | k8s | k8s.pod.cpu.usage, k8s.node.memory.working_set |
| GenAI spans / metrics | gen_ai | gen_ai.client.operation.duration, gen_ai.client.token.usage |
| Custom SDK counters (no dot) | Everything else (bottom section) | Whatever you emit with logfire.metric_* |
The “Everything else” section at the bottom of step 1 catches metrics whose name doesn’t follow the <namespace>.<metric> convention. Custom counters emitted via logfire.metric_counter('hello.requests') land here unless you give them a dotted name.
To see a namespace appear in step 1, emit a counter from the Python SDK:
pip install logfire
export LOGFIRE_TOKEN=<your write token from project Settings → Write tokens>
import logfire

logfire.configure()
logfire.metric_counter('hello.requests').add(1)
Refresh the Metrics view. hello appears in Recently active and as its own namespace (the name has a dot). The full Python SDK metric API is in Add Metrics.
| Symptom | Likely cause |
|---|---|
| Metric appears in the catalog but the chart is empty | The metric stopped reporting within the current window. The wizard hides metrics with no recent data, but the catalog entry remains. Widen the time picker. |
| Custom metric lands in Everything else instead of its own namespace | The metric name has no dot (e.g. requests_total instead of app.requests.total). The grouping is structural: give the name a dotted prefix to create a namespace. |
| Step 1 shows no namespaces at all | The project hasn’t received any metric samples yet. The wizard reads from metrics-table data; if you’re sending only spans, no namespaces will appear here. |
Two metric sources show up under system.* with overlapping series | The SDK’s system-metrics integration and an OpenTelemetry Collector running hostmetricsreceiver are both running on the same host. See the double-counting note. |
| Promoting a dimension shows fewer series than the cardinality card claimed | The chart truncates after a fixed number of series. For full breakdowns of a high-cardinality dimension, open SQL Workbench from the Open in SQL Workbench button on the card. |