Send traces from .NET
See what your .NET application is doing in Logfire: the requests it handles, how long each one took, and which ones failed. This takes about five minutes.
.NET does not have a dedicated Logfire SDK, but Logfire is built on OpenTelemetry (OTel), the open industry standard for collecting traces, metrics, and logs. The standard OpenTelemetry .NET SDK sends data straight to Logfire once you point it at the right endpoint, and you get traces (the full journey of one request, made of nested spans, where a span is one unit of work with a name, a start, and a duration) in the Logfire UI.
You need:
- A Logfire project and a write token (the credential your app uses to send data to a Logfire project). Copy one from Project → Settings → Write tokens; see Create Write Tokens.
- A working .NET SDK.
1. Create a project and add the exporter
dotnet new console -o hello-dotnet
cd hello-dotnet
dotnet add package OpenTelemetry.Exporter.OpenTelemetryProtocol
This adds the OpenTelemetry Protocol (OTLP) exporter, the way you send data to Logfire.
2. Configure the exporter
export OTEL_EXPORTER_OTLP_ENDPOINT=https://logfire-us.pydantic.dev
export OTEL_EXPORTER_OTLP_HEADERS='Authorization=your-write-token'
The endpoint above is for the US data region. If your project is in the EU region, use https://logfire-eu.pydantic.dev instead.
3. Add the code
Replace the contents of Program.cs:
using System.Diagnostics;
using OpenTelemetry;
using OpenTelemetry.Resources;
using OpenTelemetry.Trace;

// ActivitySource is .NET's built-in tracer.
var activitySource = new ActivitySource("hello-dotnet");

using var tracerProvider = Sdk.CreateTracerProviderBuilder()
    .AddSource("hello-dotnet")
    .ConfigureResource(r => r.AddService("hello-dotnet"))
    .AddOtlpExporter() // reads the OTEL_EXPORTER_OTLP_* environment variables
    .Build();

using (var activity = activitySource.StartActivity("hello"))
{
    activity?.SetTag("example", "true");
}

// Disposing the provider (end of the program) flushes and sends the span.
4. Run it
dotnet run
Open the Live view in Logfire. Your hello span appears as it arrives:
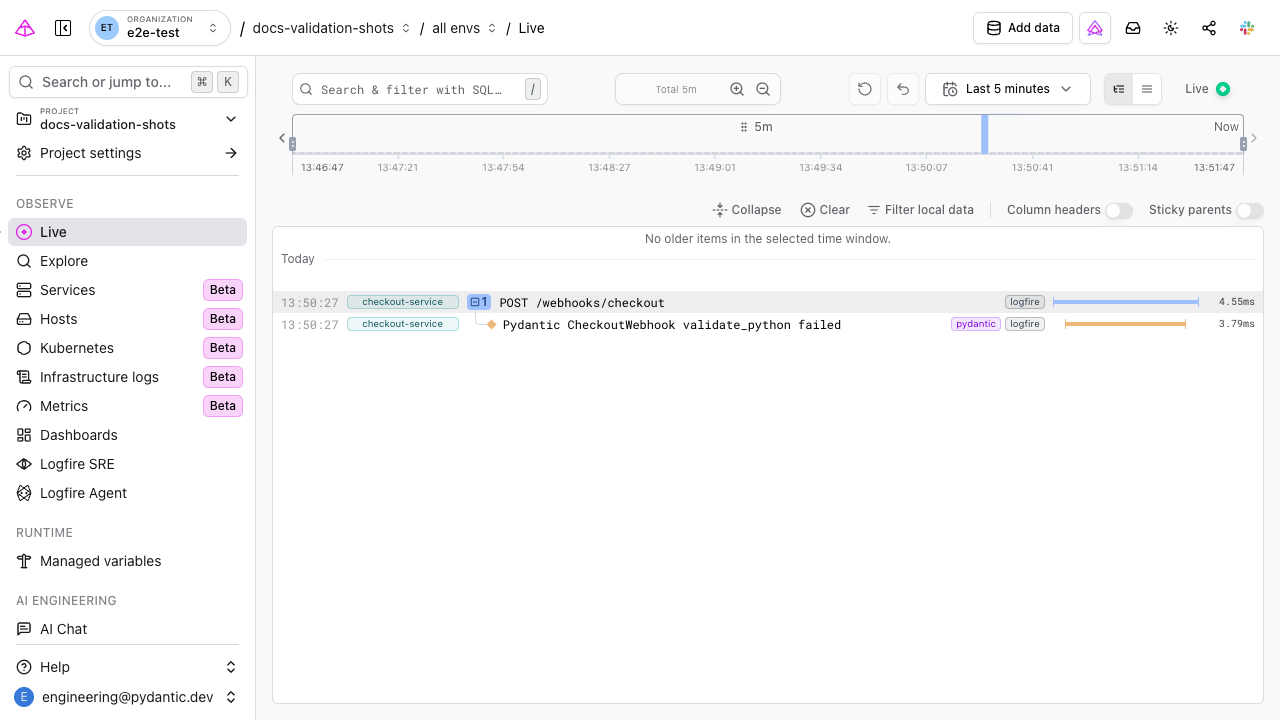
Each row is one span, with its service, name, and duration. The screenshot shows a busier app; your run appears as its own row, service hello-dotnet and span hello, which you can click to open the full trace.
If you would rather not set environment variables, pass the options to AddOtlpExporter:
.AddOtlpExporter(o =>
{
    o.Endpoint = new Uri("https://logfire-us.pydantic.dev");
    o.Headers = "Authorization=your-write-token";
})
| Symptom | Likely cause | Fix |
|---|---|---|
| Connection refused, or nothing arrives | The endpoint points at the wrong region | Confirm the endpoint matches your data region (logfire-us/logfire-eu) |
| Nothing exported even though config looks right | The tracer provider only records sources you register | Make sure .AddSource("...") matches the name you passed to new ActivitySource("...") |
A 404 when configuring the endpoint in code with http/protobuf | Setting o.Protocol = OtlpExportProtocol.HttpProtobuf makes the code Endpoint property used as-is, without appending the signal path | Include /v1/traces in the URL yourself, or leave the protocol on its default (gRPC), which needs no path |
| Can’t tell what the SDK is doing | No local visibility into what is being recorded | Add the OpenTelemetry.Exporter.Console package, then .AddConsoleExporter() to the builder, to print each span to your terminal as it is created |
- New to tracing? Core concepts explains spans and traces and how to read them.
- Building an ASP.NET Core app? Add the
OpenTelemetry.Extensions.Hostingpackage and automatic instrumentation for incoming requests, HTTP clients, and databases. See the OpenTelemetry .NET docs. - Another language? See Language support, or Alternative clients for the generic pattern.