Hosts
The Hosts view shows every host shipping system metrics to your project. It shows CPU, memory, load, disk and network alongside the application traces those hosts produced. Kubernetes nodes show up here too, tagged so you can tell them apart from bare VMs.
You’ll find Hosts in the project sidebar, between Services and Kubernetes.
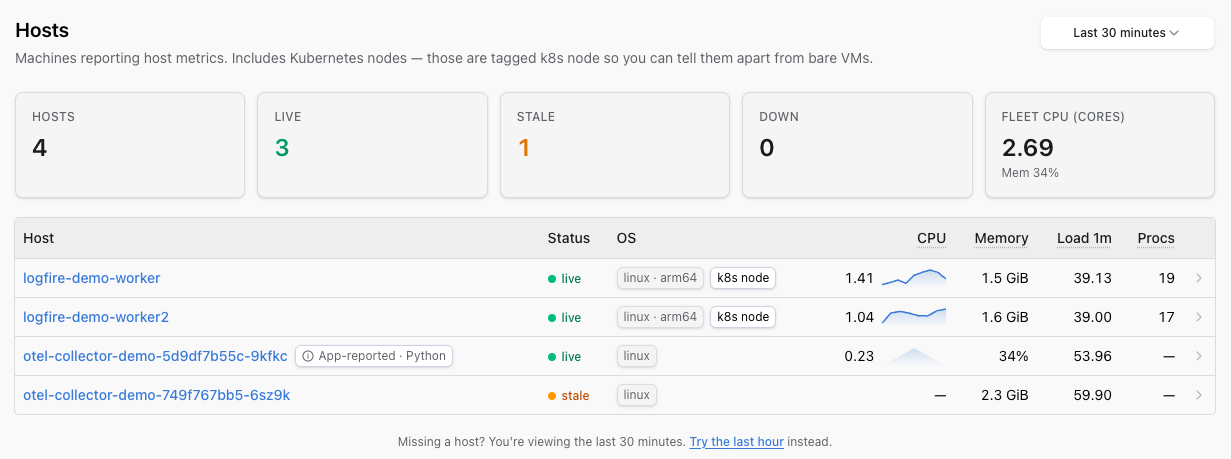
Each row is a host, with at-a-glance columns:
- Status:
liveif the host emitted a sample in the last minute,stalebetween 1 and 5 minutes,downonce it’s been over 5 minutes since the last sample. - OS and architecture.
- CPU with an inline sparkline.
- Memory (percent or bytes depending on what the collector reports).
- 1-minute load.
- Running process count.
Summary cards across the top of the page give you the fleet shape: total hosts, live / stale / down counts, and fleet CPU in cores.
Sort by any column to find the box that’s hot, the box that went stale, or the host with the most processes.
Click a row to open the host detail page. You’ll see trend charts for:
- CPU
- Memory
- 1-minute load
- Disk: split by direction (reads vs writes), not collapsed into a total.
- Network: split by direction (in vs out), not collapsed into a total.
Disk and network being direction-split is useful when, for example, your nightly backup is saturating writes but reads look fine.
Hosts populate from the standard OpenTelemetry hostmetricsreceiver. No proprietary agent, no separate install: the same OpenTelemetry Collector you already use for traces can collect host metrics with a small block in its config. The Hosts page populates within about a minute or two of the next collection cycle.
A working setup for a single host (Linux VM, container host, or laptop), exporting straight to Logfire:
receivers:
  hostmetrics:
    collection_interval: 30s
    # Set root_path: /hostfs when running the collector inside a container
    # with the host filesystem bind-mounted at /hostfs (Linux only).
    scrapers:
      cpu: {}
      memory: {}
      load:
        cpu_average: true         # normalise load across CPUs
      disk: {}
      filesystem:
        include_virtual_filesystems: false
      network:
        exclude:
          interfaces: [lo, "veth.*"]
          match_type: regexp
      paging: {}
      processes: {}

processors:
  memory_limiter:
    check_interval: 1s
    limit_percentage: 80
    spike_limit_percentage: 25
  resourcedetection:
    detectors: [env, system, ec2, gcp, azure]    # add `docker` only if you bind-mount /var/run/docker.sock into the collector
    override: false               # SDK-supplied attributes win
  batch: {}

exporters:
  otlphttp/logfire:
    endpoint: https://logfire-us.pydantic.dev   # or https://logfire-eu.pydantic.dev
    headers:
      Authorization: ${env:LOGFIRE_TOKEN}

service:
  pipelines:
    metrics:
      receivers: [hostmetrics]
      processors: [memory_limiter, resourcedetection, batch]
      exporters: [otlphttp/logfire]
The pipeline shape (memory_limiter first, batch last, enrichment in the middle) is the same for any other receivers you add. See OpenTelemetry Collector Overview for the broader patterns and authentication options. If you haven’t set anything up, the empty state on the Hosts page also deep-links to the Everything else tab of the add-data wizard.
The Hosts inventory keys hosts on host.id and host.name. Without them, a single host can appear duplicated, or N replicas of a containerised collector can collapse into one fake host. The resourcedetection processor’s system detector fills host.id from the machine ID on Linux. Add the ec2, gcp, or azure detectors when running on those clouds (and eks, gke, or aks when running on their managed Kubernetes services) so the right cloud metadata enriches the hosts. Setting override: false makes sure an SDK-supplied host.name wins when there’s one already.
Hosts inside a Kubernetes cluster are recognized as nodes and appear on the Kubernetes view as well as in the Hosts inventory. The dedup hinges on host.name matching k8s.node.name. If you run a node-scoped DaemonSet collector, set both attributes from the downward API (spec.nodeName) so the same string lands in both places. Otherwise the Hosts list will show one row per pod replica instead of one row per node.
If your workload is a Python app already using Logfire, you can emit system metrics directly from the SDK with logfire.instrument_system_metrics() instead of (or alongside) running a collector. Logfire pre-populates the host.name resource attribute (overridable via resource_attributes, see the SQL reference), so the app’s host shows up here automatically.
Save the config above as collector.yaml, then:
docker run --rm \
  -v "$(pwd)/collector.yaml:/etc/otelcol-contrib/config.yaml" \
  -e LOGFIRE_TOKEN=<your write token from project Settings → Write tokens> \
  otel/opentelemetry-collector-contrib:latest
The Hosts page populates within about a minute. To collect metrics from the host (not the container), bind-mount the host’s filesystem at /hostfs and set root_path: /hostfs in the receiver block.
| Symptom | Likely cause |
|---|---|
| Host doesn’t appear in the inventory | Metrics arrived without a host.id (or host.name). Add the system (and any cloud) detector to your collector’s resourcedetection processor. |
| Same physical host shows up twice | Two sources are reporting different host.id values, for example the SDK reports the container ID while the Collector reports the machine ID. Pick one source per host, or set host.id explicitly. |
| Every replica of a containerised collector appears as one fake host | host.id is being read from inside the container (so every replica reports the same value). Bind-mount the host’s filesystem and set root_path: /hostfs so resourcedetection’s system detector reads the real machine ID. |
All hosts went stale at the same moment | The collector restarted, or a network blip is blocking exports. The page is just a window on what arrived. Confirm with the collector’s own logs. |
| Kubernetes node appears as both a host and a node, but with different names | host.name does not match k8s.node.name. Set both from the downward API (spec.nodeName) so they dedup correctly. See Hosts that are Kubernetes nodes. |