LLMs
The LLMs page is the per-model inventory of every LLM your application is calling. Each row shows calls, latency, tokens and cost for one (provider, model) pair, and the LLM detail page links into the trace for each individual call.
For inspecting an individual LLM call inside a trace, the LLM Panels guide covers the in-trace view; this page covers the per-model and per-agent analytics surfaces.
You’ll find this view in the project sidebar.
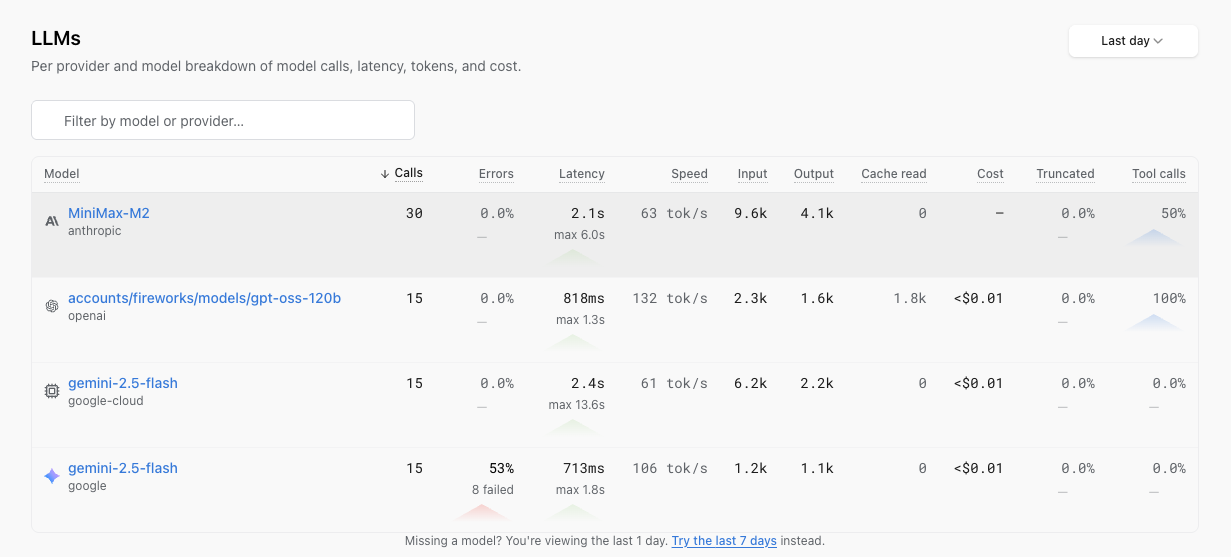
Each row is a model your application has called in the window. Columns:
- Calls: total requests to the model.
- Errors: share of failed calls.
- Latency: average per call, with the max in the window underneath.
- Speed: throughput in tokens per second.
- Input and Output: token totals.
- Cache read: cached input tokens (for providers that bill them separately).
- Cost: calculated from
genai-prices, our open-source pricing dataset. - Truncated: share of responses cut off because they hit the model’s max-token cap.
- Tool calls: share of calls that returned a tool call.
Sort by cost to see which model is spending the most, by error rate to see which is failing, by truncated rate to see which is hitting limits. The default window is Last day; a footer link offers Last 7 days if the model you’re looking for hasn’t reported recently.
Click a row to open the LLM detail page.
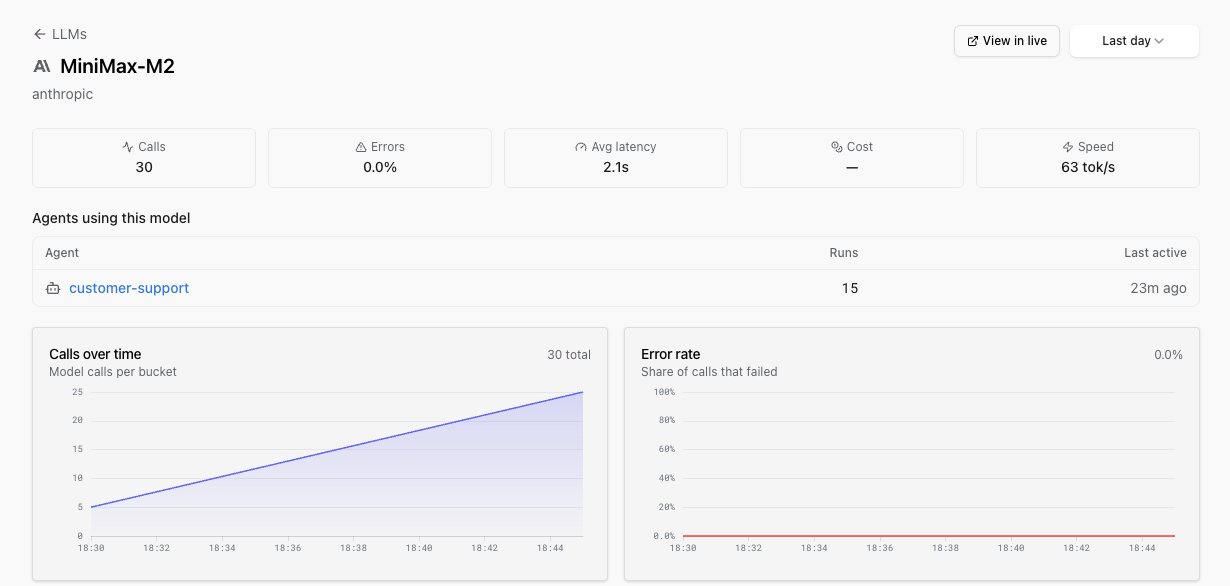
You’ll see five headline metric cards (Calls, Errors, Avg latency, Cost, Speed), a grid of trend charts (Calls over time, Error rate, Latency, Tokens, Cost, Truncated, Tool calls), and two tables:
- Agents using this model: which agents (by Pydantic AI agent name or
gen_ai.system+gen_ai.request.modelpair) are calling this model and how much. Direct LLM calls with no enclosing agent run don’t appear here. - Recent calls: the most recent invocations, each linking straight to the trace in the Live View via a View in live button in the header.
On the agent run detail page you’ll find two new charts:
- Tool calls per run: average and p90, side by side.
- Turns per run: average and p90, side by side.
Averages hide the runaway runs: the one that fired 40 tools where the median fired three, the one that ground through 12 turns where the median settled in two. The p90 view makes those visible without writing a dashboard.
Each agent run has a Tools tab that shows what was actually configured for that run: tool definitions, thinking config, max tokens, sampling parameters, and any other model settings, all read from the gen_ai.* OpenTelemetry attributes on the agent span. It’s the answer to “why did the agent behave like that on this run?” without making you expand spans and read raw JSON.
Everything on these pages reads from the OpenTelemetry spans your application is already producing. The columns rely on the gen_ai.* OpenTelemetry semantic conventions for GenAI spans.
The provider attribute is moving in the spec from gen_ai.system to gen_ai.provider.name. The older gen_ai.system is still the most common form emitted by instrumentations today, so Logfire reads it first and falls back to gen_ai.provider.name for SDKs that have already migrated. Truncation is detected from gen_ai.response.finish_reasons (a plural array per the current spec).
| Column on the LLMs page | Attribute(s) | When missing |
|---|---|---|
| Row exists | gen_ai.system (or newer gen_ai.provider.name) + gen_ai.request.model | Calls land in an (unknown) row. |
| Calls | count of spans where the provider attribute is set | - |
| Errors | spans whose otel_status_code column is ERROR (derived from the OTel Status.code) or whose is_exception column is true (set when the span has an exception event recorded on it) | All rows show 0%. Verify your SDK is mapping API errors to span errors. |
| Latency | span duration | - |
| Speed | gen_ai.usage.output_tokens / latency | 0 tok/s if output_tokens is missing. |
| Input / Output | gen_ai.usage.input_tokens, gen_ai.usage.output_tokens | Columns show 0 and Cost is forced to 0. |
| Cache read | provider-specific cached-token attribute | Empty (only some providers bill cached input separately). |
| Cost | operation.cost (a Logfire / genai-prices convention, not in the OTel spec) if set, else computed from tokens | Row priced at 0 if tokens are missing. |
| Truncated | 'length' in gen_ai.response.finish_reasons (a plural array per the current spec) | Truncation rate shows 0%. |
| Tool calls | presence of tool-call attributes on the span | Tool-call rate shows 0%. |
| Provider badge | gen_ai.system (or newer gen_ai.provider.name) | Row groups under “unknown”. |
The provider label is whatever the SDK reports. OpenAI-compatible providers (e.g. a Fireworks model accessed via the OpenAI shape) will surface as openai; Anthropic-shape providers (e.g. MiniMax) surface as anthropic. That’s a faithful reflection of the wire shape; it’s not a bug.
Token counts often only arrive on the final streaming chunk. Instrumentations that close the span on the first chunk lose gen_ai.usage.input_tokens / gen_ai.usage.output_tokens, and with them, both the tokens columns and the cost. If a model row is appearing on the LLMs page but the token / cost columns are empty, this is the usual cause.
If you route the spans through an OpenTelemetry Collector, keep gen_ai.* attributes intact:
- Audit any
attributesortransformprocessors with a denylist. Addinggen_ai.*to one will drop the data the LLMs page needs. batchandmemory_limiterare safe.- Tail sampling that drops non-error spans will drop most of your LLM telemetry and make the per-model averages look wrong.
Costs come from genai-prices. See LLM Panels for the full discussion of how costs are computed when operation.cost is or isn’t already on the span.
Any instrumentation that emits the OpenTelemetry gen_ai.* conventions lands in the LLMs and agent views correctly. That includes:
- Pydantic AI: wired up by default.
- OpenAI
- Anthropic
- Google Gen AI
- LangChain
- LiteLLM
- Claude Agent SDK
- Mirascope, Magentic, DSPy, LlamaIndex, MCP
If you build with another framework that emits the same conventions (directly or via OpenLLMetry), the views light up the same way.
The smallest path from an empty project to a populated LLMs row, using the OpenAI instrumentation:
pip install 'logfire[openai]'
export LOGFIRE_TOKEN=<your write token from project Settings → Write tokens>
import logfire
import openai

logfire.configure()
logfire.instrument_openai()

openai.OpenAI().chat.completions.create(
    model='gpt-4o-mini',
    messages=[{'role': 'user', 'content': 'hi'}],
)
Refresh the LLMs page. A row for gpt-4o-mini (provider openai) should appear within a minute. For other instrumentations, the LLM Panels guide has the per-provider list.
The inventory groups rows by (provider, model). Beyond the text search at the top, there are no dropdowns for filtering by environment, agent or user on this page yet. For per-environment, per-agent, per-user, per-feature or per-tenant breakdowns, query the records table directly in SQL Workbench. Every GenAI span carries the gen_ai.* attributes alongside deployment.environment.name and any custom resource attributes you’ve set, so you can slice cost, latency or token usage by whatever dimension matters.
| Symptom | Likely cause |
|---|---|
| Model row is missing | The span has no provider attribute (gen_ai.system or gen_ai.provider.name) and no gen_ai.request.model. Use one of the supported instrumentations, or set the attributes manually if you’re rolling your own. |
Row shows under (unknown) provider | The provider attribute is missing while gen_ai.request.model is set. The page falls back to (unknown) rather than dropping the call. |
| Tokens or Cost columns are 0 | Streaming is closing the span on the first chunk, so the final gen_ai.usage.{input,output}_tokens attributes never land on the span. See Streaming gotchas. |
| Truncated rate is 0% even though responses are being cut off | Missing gen_ai.response.finish_reasons array on the span (or the legacy singular gen_ai.response.finish_reason is being emitted; the LLMs page reads the plural form). |
| Tool-call rate is 0% on a model you know calls tools | Instrumentation isn’t recording tool-call attributes on the LLM span. The supported instrumentations all do this; custom ones may not. |
| Average per-model latency dropped after enabling the Collector | The Collector is tail-sampling out non-error spans, so the page is averaging only the errored calls. Either disable tail sampling or sample independently of the gen_ai.* pipeline. |