Send your first trace
Go from install to your first trace in about 5 minutes. A trace is the full record of one request, job, task, or agent run from start to finish, made of nested spans; a span is one operation within it, with a name, a start, and a duration. Logfire has native SDKs for Python, JavaScript/TypeScript, and Rust, plus any language through OpenTelemetry (OTel), the open industry standard it is built on.
You need a Logfire account and a project to send your data to:
- Create a free account and follow the prompts. Your data region (where your data is stored) is shown at the foot of the sign-up card, with a link to switch to the other one.
- Create your first project when asked. A project is a namespace that holds your data; everything you send to Logfire belongs to one.
Choose a runner below and run the setup command from your application’s directory. uvx requires
uv, while npx requires Node.js. The command signs you in, connects
the directory to a Logfire project, then asks an installed Codex or Claude Code agent to add Logfire
and verify that data arrives:
Set up Logfire with your coding agent:
logfire-cli wizard uvx logfire-cli wizard
Pick your language below; the Python, JavaScript/TypeScript, and Rust tabs are complete, runnable examples.
1. Install and sign in
Run this in your project’s terminal to install the SDK and sign in (logfire auth opens your browser to log in, no API key needed):
uv add logfire
uv run logfire auth
Prefer pip? Use pip install logfire, then run logfire auth directly (without the uv run prefix). Prefer conda? Use conda install -c conda-forge logfire.
2. Add Logfire to your app
import logfire

logfire.configure()

with logfire.span('greeting'):
    logfire.info('Hello, {name}!', name='world')
configure() connects your app to Logfire. span() records one operation, and info() writes a log (a timestamped record of a single event) inside it, so together they make your first trace.
3. Run it
uv run hello.py
The first run asks you to pick or create a Logfire project, then sends your trace.
1. Install and connect
Copy a write token (the credential your app uses to send data to a Logfire project) from Project → Settings → Write tokens, then install the SDK and set the token:
npm install @pydantic/logfire-node
export LOGFIRE_TOKEN="your-write-token"
2. Add Logfire to your app
import * as logfire from '@pydantic/logfire-node'

logfire.configure({ serviceName: 'hello-logfire' })

await logfire.span('greeting', {
  callback: async () => {
    logfire.info('Hello world!')
  },
})

await logfire.shutdown()
span() records one operation, and the info() inside it is a log nested in that span, so together they make a trace. shutdown() sends anything still buffered before the script exits.
3. Run it
node hello.mjs
For browsers, Cloudflare Workers, and frameworks, see Language support.
1. Install and connect
Copy a write token (the credential your app uses to send data to a Logfire project) from Project → Settings → Write tokens, then add the SDK to your project and set the token:
cargo add logfire
export LOGFIRE_TOKEN="your-write-token"
2. Add Logfire to your app
fn main() -> Result<(), Box<dyn std::error::Error>> {
    let logfire = logfire::configure().finish()?;
    let _guard = logfire.shutdown_guard();

    logfire::span!("greeting").in_scope(|| {
        logfire::info!("Hello, world!");
    });

    Ok(())
}
configure() connects your app to Logfire. span!() records one operation, and the info!() inside it is a log nested in that span, so together they make your first trace. shutdown_guard() flushes any buffered data when it is dropped at the end of main.
3. Run it
cargo run
Logfire works with any language that supports OpenTelemetry (OTel), the open standard it is built on. See Language support for Go, Java, .NET, and more.
Open the Live view in Logfire. Your greeting trace appears as it arrives:
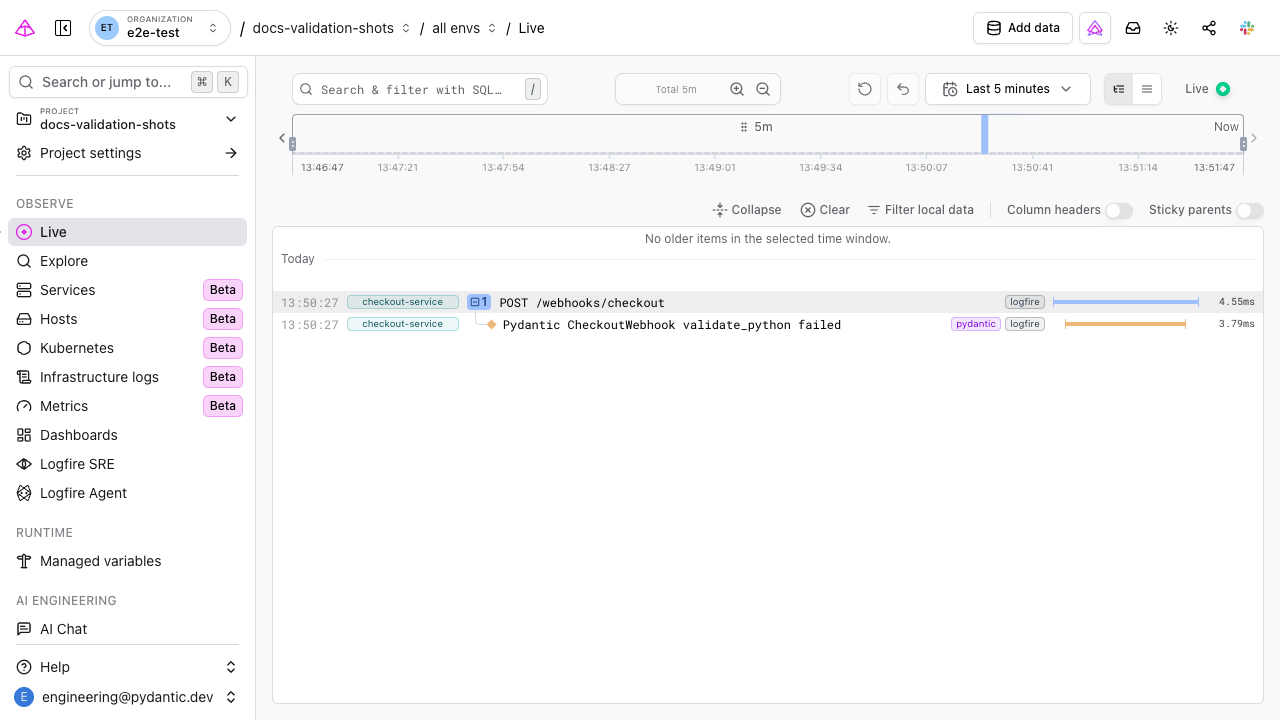
Each row is one span, with its service, name, and duration. Click a span to open its full trace and read its details. The example above shows a busier app: a checkout request with a nested validation error. Your greeting span shows up as a row, with the Hello world! log nested inside it.
The greeting span is a manual example. Most of your traces should come automatically: add one line to instrument a framework or library you already use, and Logfire records every request, query, and outgoing call as a trace, without writing spans by hand.
logfire.instrument_httpx() # trace every outgoing HTTP request
Each integration ships as an extra, so install the matching one first: pip install 'logfire[httpx]' for the example above. See Integrations for FastAPI, Django, SQLAlchemy, HTTPX, and many more.
| Symptom | Likely cause | Fix |
|---|---|---|
| Nothing appears in the Live view | Not signed in, or no project or write token set | Run logfire auth, then run your app and pick a project when prompted; or set LOGFIRE_TOKEN from Project → Settings → Write tokens |
| The view looks empty | The time range does not include now | Widen the time range in the top right |
| A short script sends nothing | The program exited before its data was sent | Logfire sends data as your program runs and on exit; in JavaScript, call await logfire.shutdown() before exiting |
- New to tracing? Core concepts explains spans and traces and how to read them.
- Want the full Python walkthrough? The Python onboarding guide adds manual tracing, auto-tracing, and metrics, step by step.
- Already using a framework? Integrations add rich tracing to FastAPI, Django, SQLAlchemy, HTTPX, and many more with one line.
- Building with AI? AI & LLM Observability shows the requests, tool calls, tokens, and cost behind your model-powered features.
- Not sure where to focus? Choose your path gives a short, ordered route for your role.
- Ready to deploy? Use a write token in an environment variable instead of the CLI.