Inspect sandbox runs
Find a sandbox session, read the Python it ran, and follow related activity when a result is slow or fails. A session is a group of related interactions, which can include several code runs and calls.
You need access to Agent Sandboxes and permission to read the project’s data. Run code in the Workbench or connect an application so the project has activity to inspect.
- Open AI Runtime > Agent Sandboxes > Overview.
- Choose a time range that includes your run. Check any active environment filters.
- Read the summary cards, then find the session under Sessions.
- Check its code-run count, calls, and failures. A missing duration shows Not reported, rather than zero.
The cards count Sessions, Code runs, Host calls, OS calls, and Failures in the selected window. Host calls are calls from sandbox code back to functions supplied by the client. OS calls are operating-system operations reported by the runtime. The overview shows activity from Logfire’s hosted sandboxes. It excludes activity from sandboxes that run in your own application. It does not show the sandbox’s current capacity.
Select View code on the session row. The dialog lists the code runs with source recorded in the selected time range. If some runs are missing, open Live view to see the rest. Use the copy control beside a run to copy its source.
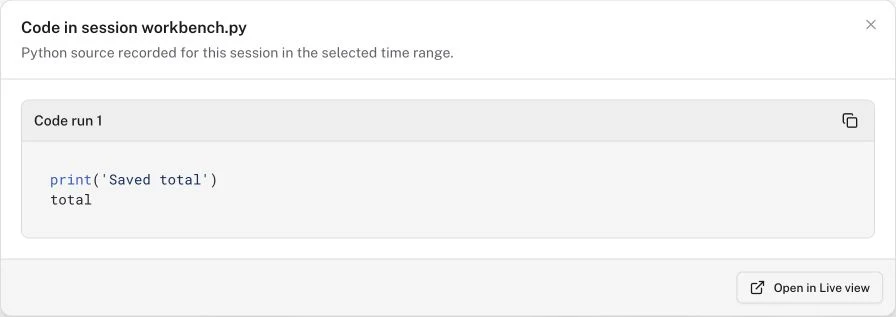
Example source inspector with sample code.
Select Open in Live view in the code dialog, or select the session name or its Live view icon on the session row. Live view shows a trace, the full journey of one request, made of nested spans. A span is one unit of work: a single operation, with a name, a start, and a duration. Expand the session to inspect its code runs and related calls.
Select a run code span in Live view, then open its Code tab. For a run with recorded function calls, Source shows the Python code and a timeline of those calls.
- Select Step over to move to the next recorded call, or Step back to return to the previous one.
- Read Call attributes for the function, arguments, duration, and source location under Called from.
- Read Return value for the selected call’s result.
The source highlights the selected call and shows its return value beside the expression. The trace list highlights the same call while the run code span stays selected. You can also choose a call with the Run timeline slider or a source gutter marker.
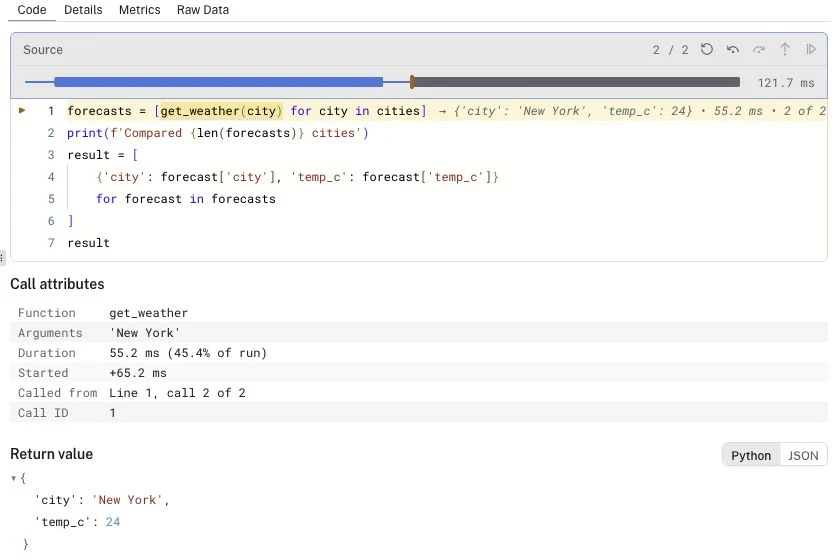
Two calls on the same source line have separate arguments, return values, and timings.
Scroll below the call inspector to read Result for the whole run and Arguments for its inputs. These differ from the selected function call’s arguments and return value. The print stdout records in the trace list contain standard output, the text the program prints.
Check that the session and recorded source match the example you ran. Open it in Live view. Confirm that its code runs and related calls match the source shown in the code dialog. For a run with several function calls, step between them and check that their arguments and return values change.
- The overview is empty. Widen the time range, check the project and filters, then refresh. Activity from sandboxes that run in your own application appears in Live view but is outside this hosted overview.
- View code is unavailable or source is missing. The selected window may lack a session record or source-bearing code runs. Widen it and inspect the related activity in Live view.
- A row says Activity without session details. The project received activity without matching session details in this window. Open Live view to inspect the records that are available.
- A call is missing from the timeline. Load more spans in the trace list. The inspector uses the calls that the list has loaded. A
+after the call count means more calls may exist.
Return to the Workbench to reproduce the issue with a smaller input.