Manage OpenTelemetry Collectors with Fleet | Logfire
Install an OpenTelemetry Collector on a host with one command, or connect the Collectors in a Kubernetes cluster, then change what they collect and where they send it from Logfire. An OpenTelemetry Collector is a program that gathers telemetry (host metrics, log files, data your applications send it), processes it, and sends it on.
Fleet needs to be turned on for your account: see Fleet. Each Collector runs the pipeline in its Collector policy, which you edit in Logfire: see Change policies.
One command installs a Collector as a service and connects it to Fleet. It works on Linux, macOS and Windows.
-
In Fleet management, open Collectors, select Add Collector, then Host.
-
Under What to collect, choose a starting point, such as host monitoring for the host’s operating system or file logs. Fleet creates a host policy from it, or uses an existing policy you pick. You can change the policy later.
-
Select Get install command, then choose the host’s operating system.
-
Copy the enrollment key. Logfire shows it once. It lets a host join your project, and you can revoke it in your project’s Fleet settings.
-
Run the command Logfire shows on the host, and paste the key when it asks. On Linux, for a project in the US region:
Terminal uvx --from 'logfire-cli>=0.1.17' logfire-cli --beta --region us --org <your-org> collector install \ --project <your-project> --token-stdin --yes--token-stdinmakes the installer ask for the key without showing it as you type, which keeps it out of your shell history. Use--region eufor the EU region. The command needs uv, and the installer asks for administrator access. The host does not need to sign in to Logfire: the enrollment key places it in your project. -
Keep the setup open. It shows when the host’s first data arrives.
To install on many hosts, pipe the key from your secret store into --token-stdin, or set LOGFIRE_COLLECTOR_ENROLLMENT_TOKEN and leave --token-stdin out. Install on each host separately: don’t copy one host’s Collector state into a machine image, because it holds that host’s identity and connection key.
In a cluster, Fleet manages Collectors through the OpenTelemetry Operator, the standard Kubernetes add-on that runs Collectors from OpenTelemetryCollector resources. You install one small Operator bridge in the cluster. It connects to Fleet and creates, updates and deletes the Collector resources your policy describes.
-
In Fleet management, open Collectors, select Add Collector, then Kubernetes.
-
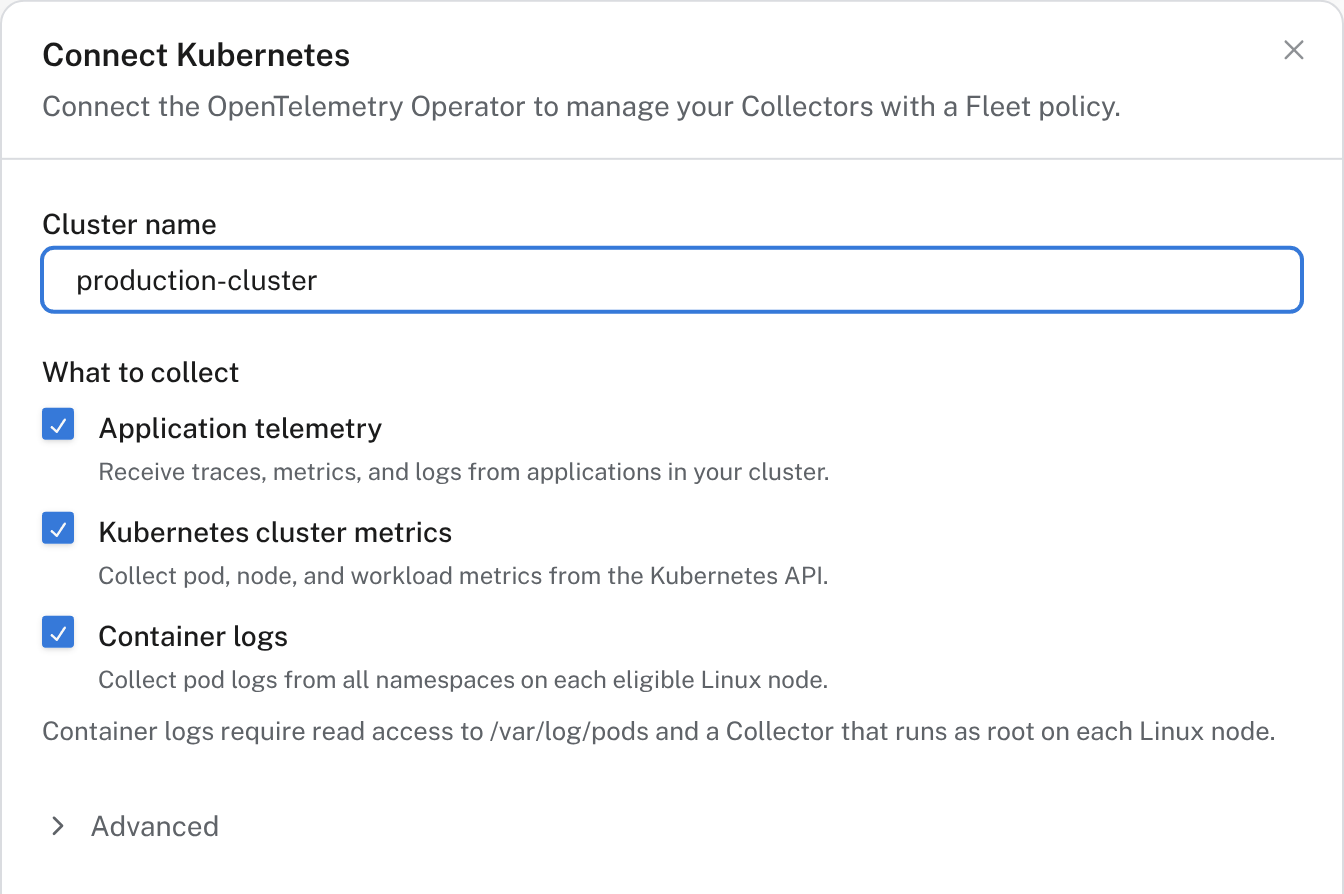
Name the cluster and choose what to collect: application telemetry sent to the cluster’s Collectors, Kubernetes cluster metrics, and container logs.
-
Under Advanced, set the Collector namespaces Fleet may run Collectors in. Turn on Limit the bridge to this policy’s components to make the bridge refuse a later policy that uses any other receiver, processor or exporter.
-
Select Get setup instructions, save the connection key Logfire shows, and follow the steps:
- Prepare your cluster: check your
kubectlcontext and that the Operator is installed. If it isn’t, install cert-manager and then the Operator, as the step shows. - Create the connection Secrets: the commands prompt for the connection key and for a Logfire write token, which the Collectors use to send data. Create a write token under Project settings → Security & access → Write tokens.
- Grant Collector read access, if you collect cluster metrics: apply
collector-permissions.yaml. - Apply the bridge: download
fleet-bridge.yamland runkubectl apply -f fleet-bridge.yaml.
- Prepare your cluster: check your
The setup checks the bridge connection, its access to Kubernetes, whether the policy applied, and whether the Collector pods are ready. These checks don’t confirm delivery: send some test telemetry and look for it in the Live view.
Don’t also run the Helm-based Kubernetes monitoring setup for the same cluster: both would collect the same data.
The Collectors tab lists one row per Collector, named by the host name or pod name it reports. Each row shows:
- Connection: whether the Collector is connected to Fleet now.
- Health: what the Collector reports about itself.
- Policy status: Applied when it runs the policy’s current version, Pending while a new version is on its way, and Failed when it refused the version.
- Policy and Environment.
Select Needs attention to show only Collectors that are disconnected, unhealthy or failed to apply their policy. By default the list shows Collectors that reported in the last hour.
Select a Collector to see what it reported: its health per component, the configuration it runs, the components it has, and its warnings and errors from the last hour with a link to the Live view. From there you can restart it, or remove a disconnected Collector’s record.
| Symptom | Check |
|---|---|
| A host never appears | Run the install command again with --dry-run to see each step. The host needs outbound HTTPS to Logfire. |
| A host appears but sends nothing | A Collector collects nothing until it has a policy. Open it and check Policy status. |
| Policy status shows Failed | Open the Collector. It reports which component or setting it could not apply. A Collector refuses a version that uses a component it doesn’t include, and keeps running the configuration it has. |
| The Kubernetes bridge never connects | Check the bridge pod’s logs in the logfire-fleet namespace, and that the connection key Secret exists there. |
| Kubernetes Collectors don’t start | Check that the Operator’s controller and webhooks are ready, and that the Collector namespaces exist. |
- Change policies: edit what your Collectors collect and roll out the change.
- Hosts and Kubernetes: see the metrics your Collectors send.