Change application telemetry settings with Fleet | Logfire
Change what a running application records and sends: its sampling rate, minimum log level, redaction and scrubbing, and which signals it exports. You change these from Logfire, with no restart or redeploy.
Fleet needs to be turned on for your account: see Fleet. Each application takes its settings from an SDK policy. A policy sets only the settings you choose; every other setting stays as the application configured it (“Application controlled”). See Change policies.
- Your application already sends data to Logfire, with a write token in its environment. Fleet doesn’t change how it sends data: it changes the SDK’s settings.
- You can load a small Fleet package into the application, as shown below for each language.
-
In Fleet management, open SDKs and select Add application.
-
Enter the application’s name, which becomes its
OTEL_SERVICE_NAME, and choose what it uses. Select Get setup instructions.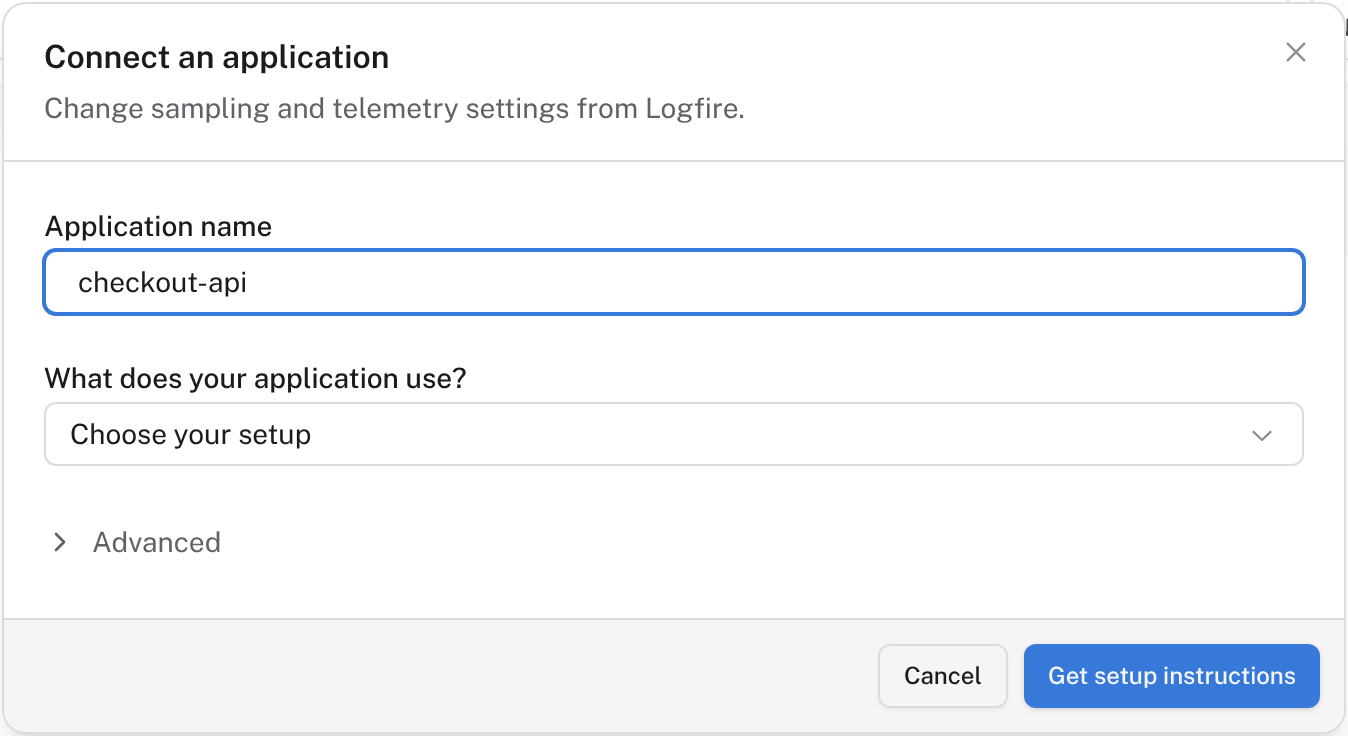
-
Install Fleet support and load it, as Logfire shows for your setup:
Requires Python 3.11+ and Logfire 5.1 or a later 5.x release.
pip install 'logfire-fleet-otel[logfire]'
Replace your logfire.configure() call. Keep its other options and your instrumentation calls:
import logfire_fleet_otel

logfire_fleet_otel.configure_logfire(
    service_name='checkout-api',  # the application name you entered in Fleet
    console=False,
)
Console output stays off so the policy controls where your telemetry goes.
Requires Python 3.11+. Keeps your existing instrumentations.
pip install logfire-fleet-otel
export OTEL_PYTHON_DISTRO=opamp
export OTEL_PYTHON_CONFIGURATOR=opamp
opentelemetry-instrument python app.py
Requires Node.js 22+. Uses OpenTelemetry automatic instrumentation.
npm install @pydantic/logfire-fleet-otel
node --import @pydantic/logfire-fleet-otel/register app.js
Requires Java 17+. Adds the Fleet extension to the OpenTelemetry Java agent 2.31.1.
curl -sSfLo opentelemetry-javaagent.jar https://repo1.maven.org/maven2/io/opentelemetry/javaagent/opentelemetry-javaagent/2.31.1/opentelemetry-javaagent-2.31.1.jar
curl -sSfLo logfire-fleet-javaagent-extension.jar https://repo1.maven.org/maven2/dev/pydantic/logfire-fleet-javaagent-extension/0.2.0/logfire-fleet-javaagent-extension-0.2.0.jar
java -javaagent:opentelemetry-javaagent.jar \
  -Dotel.javaagent.extensions=logfire-fleet-javaagent-extension.jar \
  -jar app.jar
Requires .NET 8+ on Linux (glibc, x64 or ARM64). Adds the Fleet plugin to OpenTelemetry automatic instrumentation 1.17.0. For Alpine, macOS or Windows, follow the .NET guide.
dotnet add package OpenTelemetry.AutoInstrumentation --version 1.17.0
dotnet add package Logfire.Fleet.AutoInstrumentation
export OTEL_DOTNET_AUTO_PLUGINS="Logfire.Fleet.AutoInstrumentation.Plugin, Logfire.Fleet.AutoInstrumentation"
dotnet publish -c Release -r "linux-$([ "$(uname -m)" = aarch64 ] && echo arm64 || echo x64)" --self-contained false -o ./publish
cd ./publish
./instrument.sh dotnet App.dll
Requires Go 1.25+. One call in main sets up OpenTelemetry and keeps your instrumentations.
go get github.com/pydantic/opamp-clients/go/opampotel@v0.2.0
import (
	"context"
	"log"

	"github.com/pydantic/opamp-clients/go/opampotel"
)

func main() {
	ctx := context.Background()
	// Replaces your OpenTelemetry SDK setup. Keep your instrumentations.
	sdk, err := opampotel.Setup(ctx)
	if err != nil {
		log.Fatal(err)
	}
	defer sdk.Shutdown(context.Background())
	// ...
}
- Save the Fleet connection key Logfire shows in your secret manager: you can’t view it again after closing setup. Set the variables Logfire shows before you start the application:
OTEL_OPAMP_ENDPOINT,OTEL_OPAMP_HEADERSwith the connection key, andOTEL_SERVICE_NAME. In a terminal, Logfire’s commands prompt for the key without showing it. In production, set the variables in your deployment instead. - Start the application, and select Check connection.
The connection key only manages settings. Your application keeps sending telemetry with its existing write token. Each language has a full guide in pydantic/opamp-clients, including frameworks and deployment examples.
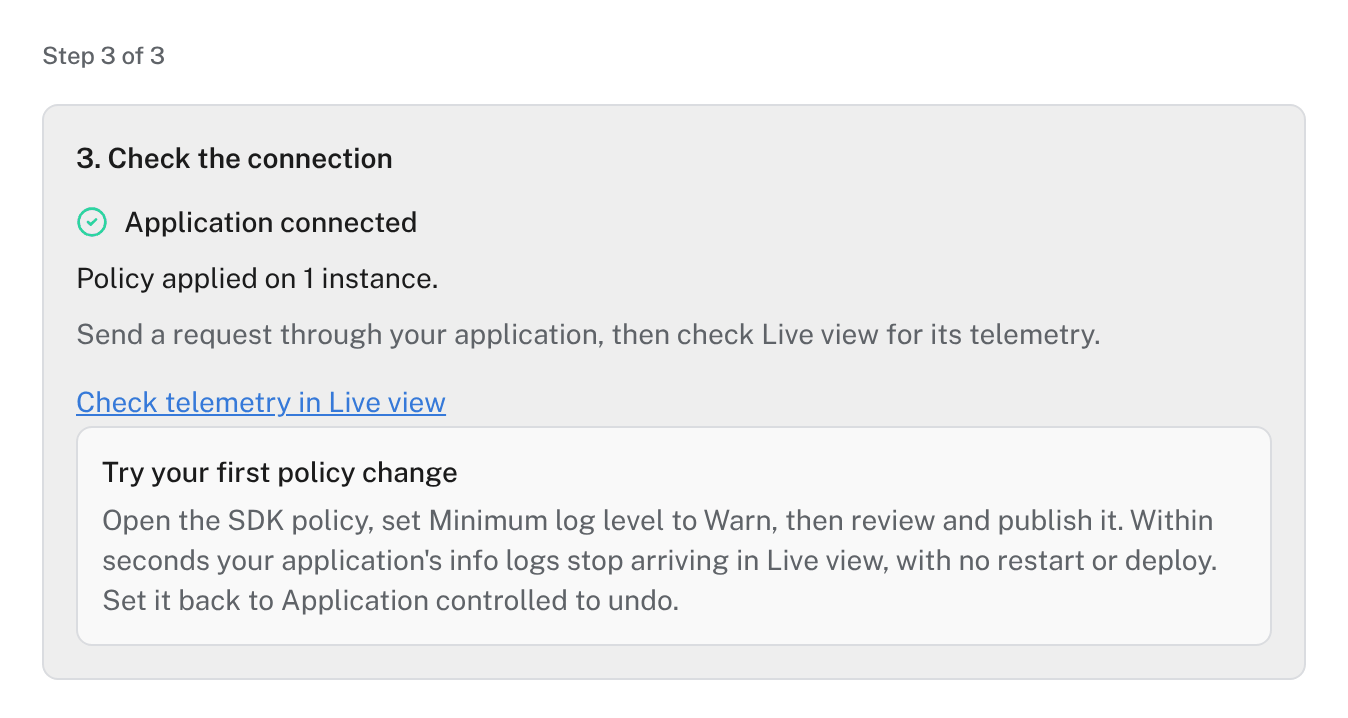
Within a few seconds of starting, the setup shows the application as connected and its policy as applied:
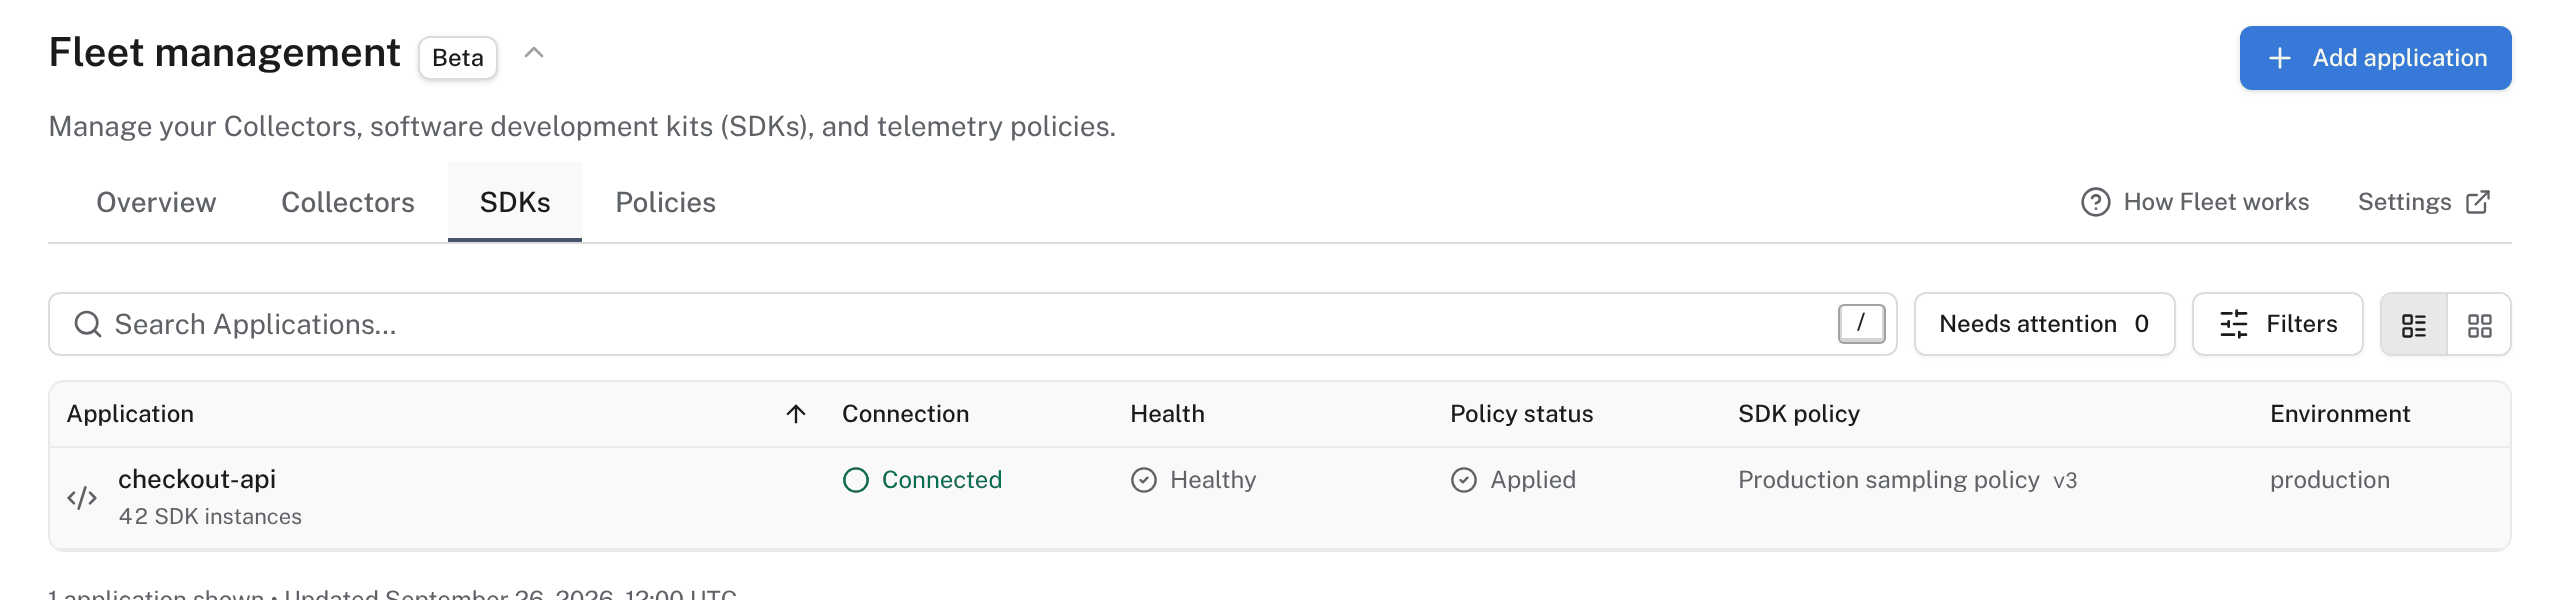
The SDKs tab then lists the application with its connection, health, policy status and SDK policy. One row covers every running instance of the application.
- Open the application’s SDK policy from the SDKs tab or Policies.
- Set Minimum log level to Warn.
- Select Review policy, then publish it.
Within seconds the application stops sending info logs to the Live view, with no restart or deploy. Set it back to Application controlled to undo.
| Symptom | Check |
|---|---|
| The application never connects | Check that the Fleet package loads before your application starts, and that OTEL_OPAMP_ENDPOINT and OTEL_OPAMP_HEADERS are set in the application’s environment. Its logs name connection and authentication errors. |
| Connected, but Policy status shows Failed | Open the application in SDKs. It reports which setting it couldn’t apply and why. |
| A setting shows as unsupported | Not every setup supports every setting. Unsupported clients are left out of a rollout’s preview. |
| No telemetry arrives | Fleet doesn’t send telemetry. Check the application’s write token and region settings. |
- Change policies: sampling rules, redaction, scrubbing and exports, and how to roll out a change to a few instances first.
- Scrubbing: what Logfire redacts by default.