Your overnight document classifier, built on the Anthropic SDK and run on a self-hosted box, is dying every night around 2am.
Logs say OOM. The agent code is unchanged. The model is unchanged. The traffic shape is identical to last week, when the job ran fine. The instinct is to bump memory and move on.
What's new
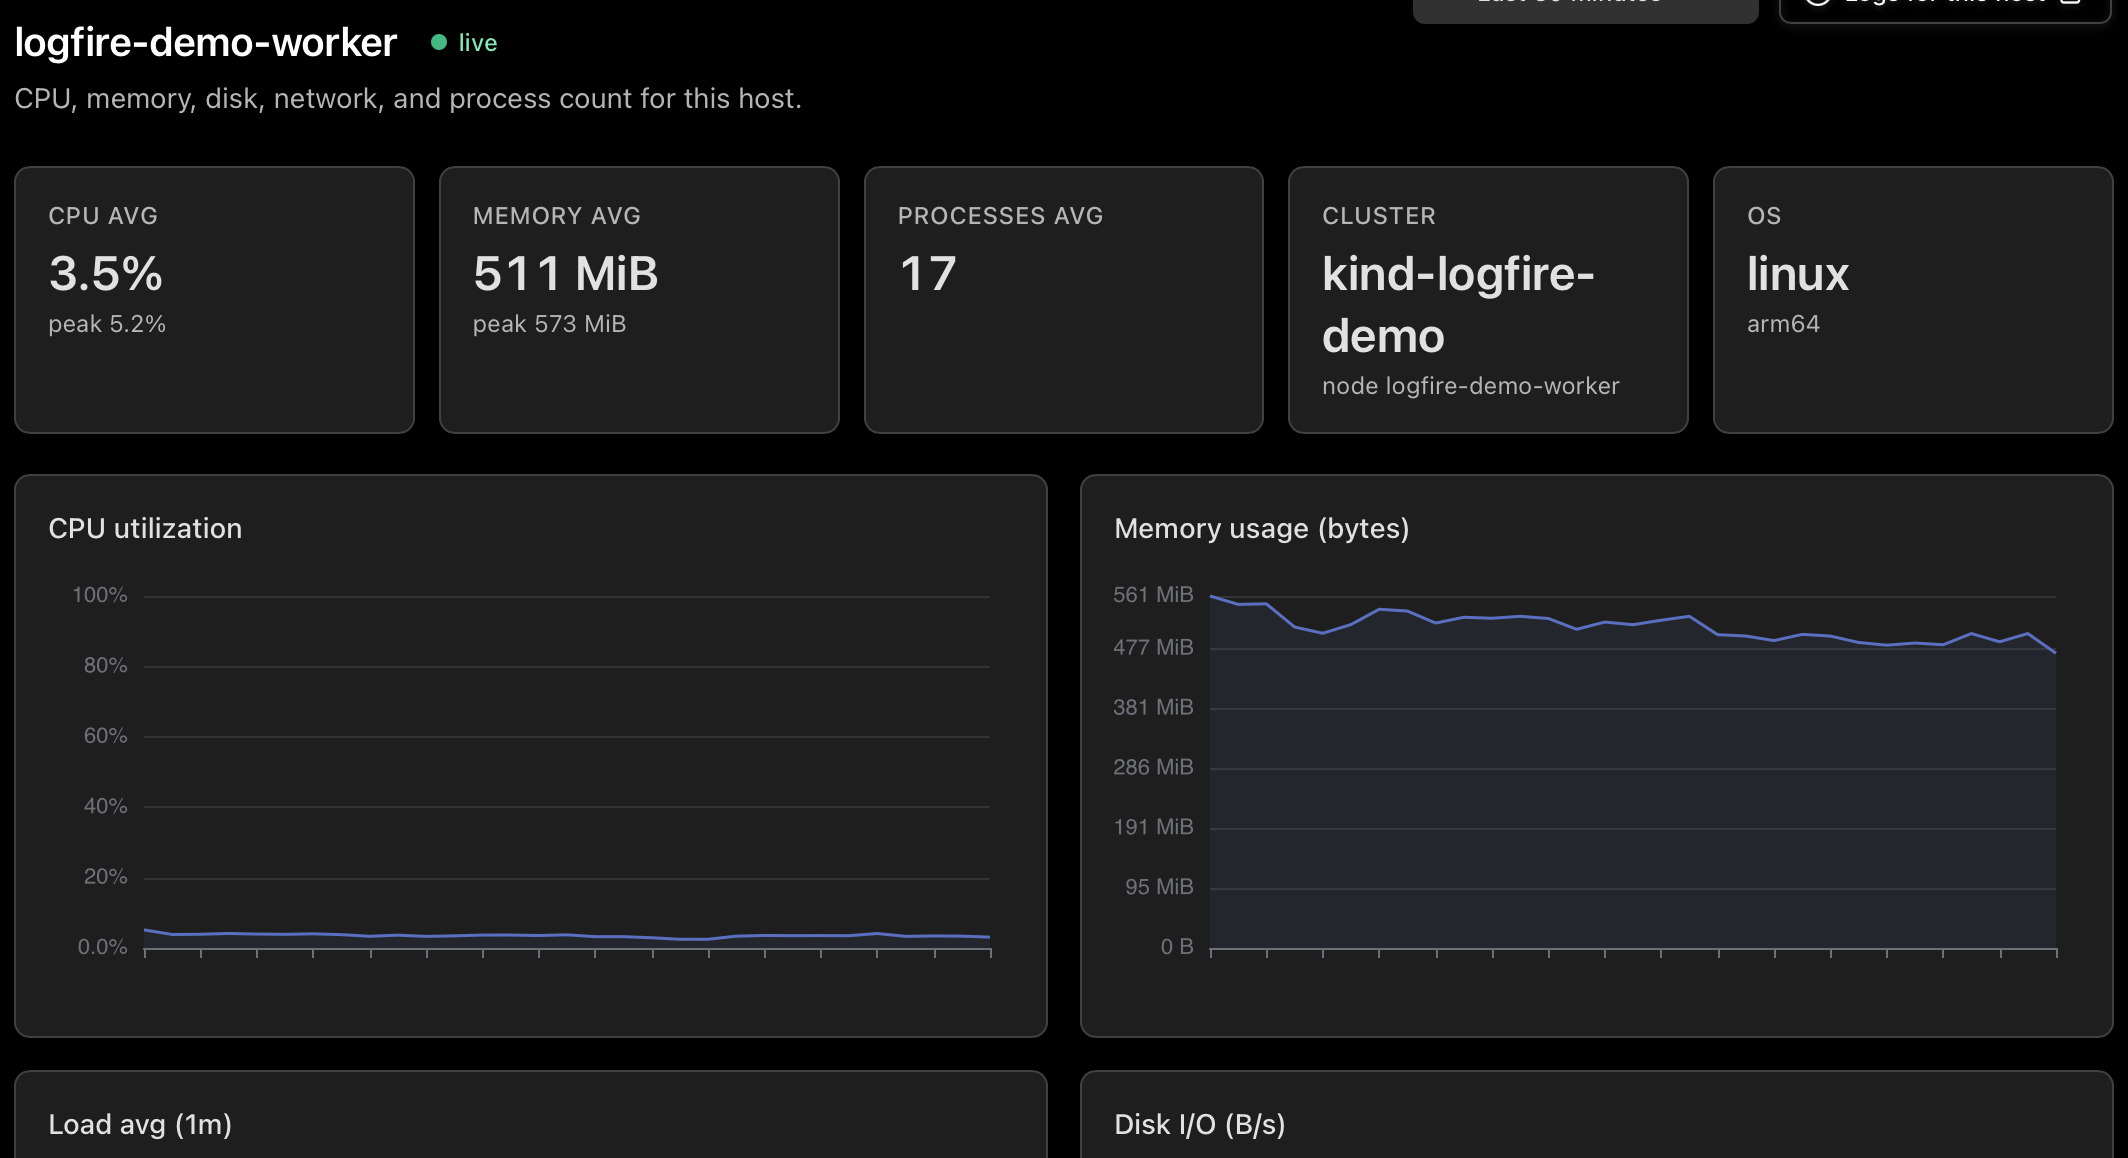
- See every host shipping metrics to your project: which are live, which are stale, which are down, and what the fleet looks like in CPU and memory.
- Drill into any host for CPU, memory, load, and disk and network charts split by direction (read vs. write, in vs. out).
- Click from any host straight to the traces from the workloads it ran in the live view.
Why this matters
Open the host running the batch job. Memory tells the story. It climbs steadily from midnight, hits 95% just before 2am, and your agent dies. But the climb does not start when the batch job starts. The climb is already in progress when the agent kicks in. Something else is eating the box.
The 1-minute load chart confirms it. Load is high while CPU is moderate, which means processes are waiting on something other than CPU. Disk I/O on the same host is spiking from midnight to 2am. There is a Postgres on this box, and Postgres runs a nightly vacuum.
Spans tell you what the agent did. Host metrics tell you whether the machine running it had any resources left to give. Plenty of tools show you both, in different products. What was missing for us was putting them in the same product, on the same trace ID, so the question "was it the box?" gets answered in the same browser tab as the trace that hit the wall.
All of this data is available to you and your closest friends: Claude, Codex, Gemini, Pydantic AI, and more via MCP and our RESTful query endpoints.
How it works
The data comes from the standard OpenTelemetry hostmetricsreceiver. There is no proprietary agent and no lock-in. The same OTel collector you already use for traces can collect host metrics with a few extra lines in its config.
Hosts are keyed in the inventory on the host.id and host.name resource attributes, populated by the collector's resourcedetection processor (the system detector on Linux, plus ec2, gcp, or azure on the matching clouds). Without those, a single host can appear duplicated or N replicas of a containerized collector can collapse into one fake host. Hosts inside a Kubernetes cluster are recognized as nodes (the dedup hinges on host.name matching k8s.node.name) and appear on the Kubernetes view as well.
Each host is marked live, stale, or down based on how recently its metrics arrived. Empty states deep-link straight to the Everything Else tab of the add-data wizard, with copy-pasteable hostmetrics config for the OTel collector.
Getting started
If your OpenTelemetry collector already has the hostmetrics receiver enabled, the Hosts page populates within about thirty seconds of the next collection cycle. If not, the empty state on the page links to the setup steps.
In our scenario, you schedule the Postgres vacuum to run an hour earlier and add a memory cap. The agent runs through the night. The trace from the previous failure is in the live view, with the host memory chart from the night of the failure open alongside it.
Full reference, including the minimum collector config and the Kubernetes-node dedup story: the Hosts view docs.
Not using Logfire yet? Get started. The free tier includes usage up to 10 million spans, our AI Gateway, and so much more.
