Pydantic Logfire
Find the data behind production ValidationErrors. Logfire records failed Pydantic validations with
their structured errors and can keep them inside the surrounding request or job trace, so you can see
what failed, where the input came from, and whether the same problem keeps happening.
You need a free Logfire account and project. From your project directory, install the SDK and sign in:
pip install logfire
logfire auth
Call instrument_pydantic() before defining or importing the models you want to monitor:
from datetime import date

import logfire

from pydantic import BaseModel

logfire.configure()
logfire.instrument_pydantic(record='failure')  # (1)


class User(BaseModel):
    name: str
    country_code: str
    dob: date


User(name='Anne', country_code='USA', dob='not-a-date')  # (2)
Successful validations stay as aggregate metrics. Failed validations create individual warning records with their structured errors.
Run the example and choose or create a Logfire project when prompted. The invalid date produces a warning record in Logfire's Live view.
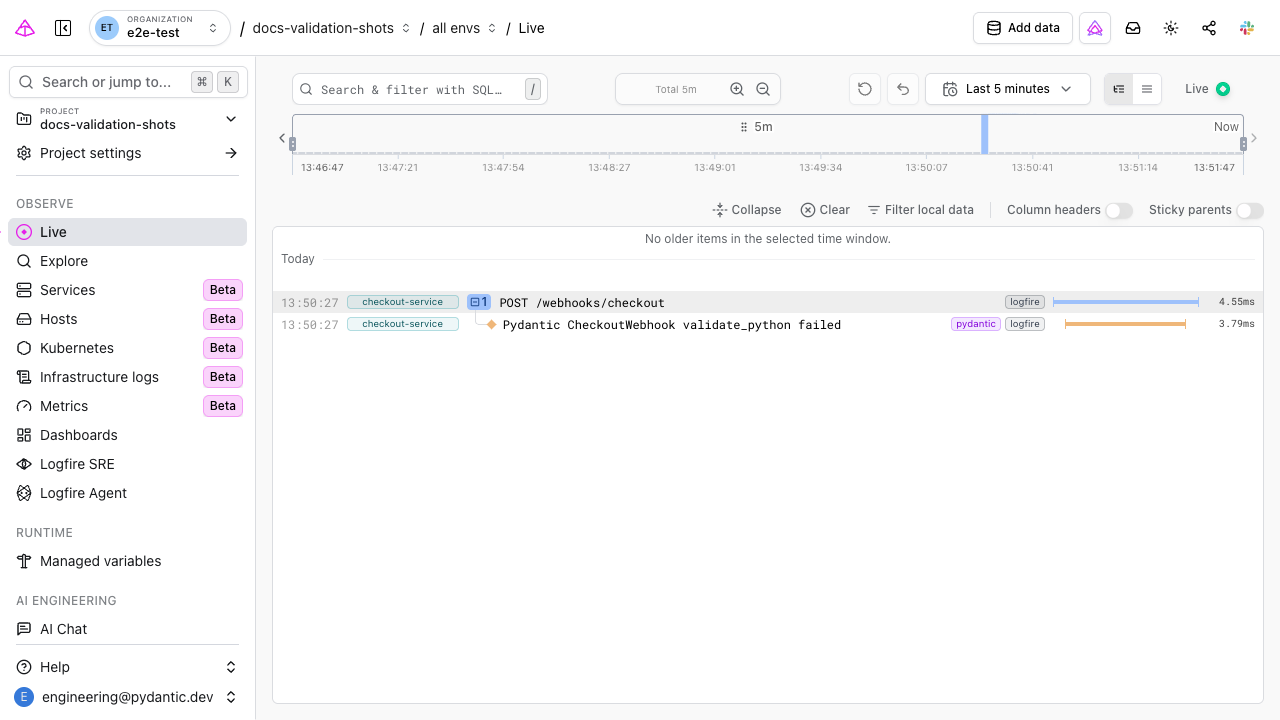
Open the warning to inspect the rejected values, error type and field path, and any request or job trace active when validation ran. For a deeper walkthrough, see Troubleshooting Validation Errors.
The record argument controls the balance between detail and data volume:
| Setting | Individual records | Metrics |
|---|---|---|
failure | Failed validations only | All validations |
all (default) | Every successful and failed validation | All validations |
metrics | None | All validations |
off | None | None |
Use failure for production troubleshooting without creating an individual record for every
successful validation. Use all while developing when you want to inspect successful inputs and
validated results too.
import logfire

logfire.instrument_pydantic(record='all')
For per-model settings, third-party model inclusion, and configuration through environment variables
or pyproject.toml, see the full
Logfire Pydantic integration reference.
Pydantic tells you which value failed. Instrument your web framework, database client, or task queue to see where that value came from and what happened around it. For example, a FastAPI trace can show the request that reached your endpoint, the failed model validation, and the response returned to the caller in one timeline.
See Logfire integrations for FastAPI, Django, Celery, SQLAlchemy, HTTPX, and more.
You can also attach a Pydantic model to your own structured log or span. Logfire preserves the model’s fields so you can inspect and query them:
from datetime import date

import logfire

from pydantic import BaseModel

logfire.configure()


class User(BaseModel):
    name: str
    country_code: str
    dob: date


user = User(name='Anne', country_code='USA', dob='2000-01-01')
logfire.info('user processed: {user!r}', user=user)
- No validation records appear: make sure
logfire.configure()runs and thatinstrument_pydantic()runs before the model class is defined or imported. - Successful validations do not appear:
record='failure'keeps them as metrics only. Userecord='all'when you need an individual span for each success. - You need to inspect successful validations too: use
record='all'. This creates an individual span for every validation, so review its data-volume and privacy implications before using it in production.