The AI observability platform that sees your whole app
Monitor your entire AI application stack, not just the LLM calls. See the model call, the agent's next step, the API request and the database query behind it in one trace. SDKs for Python, JavaScript/TypeScript and Rust, and OpenTelemetry for everything else.
Set up Logfire with your coding agent:
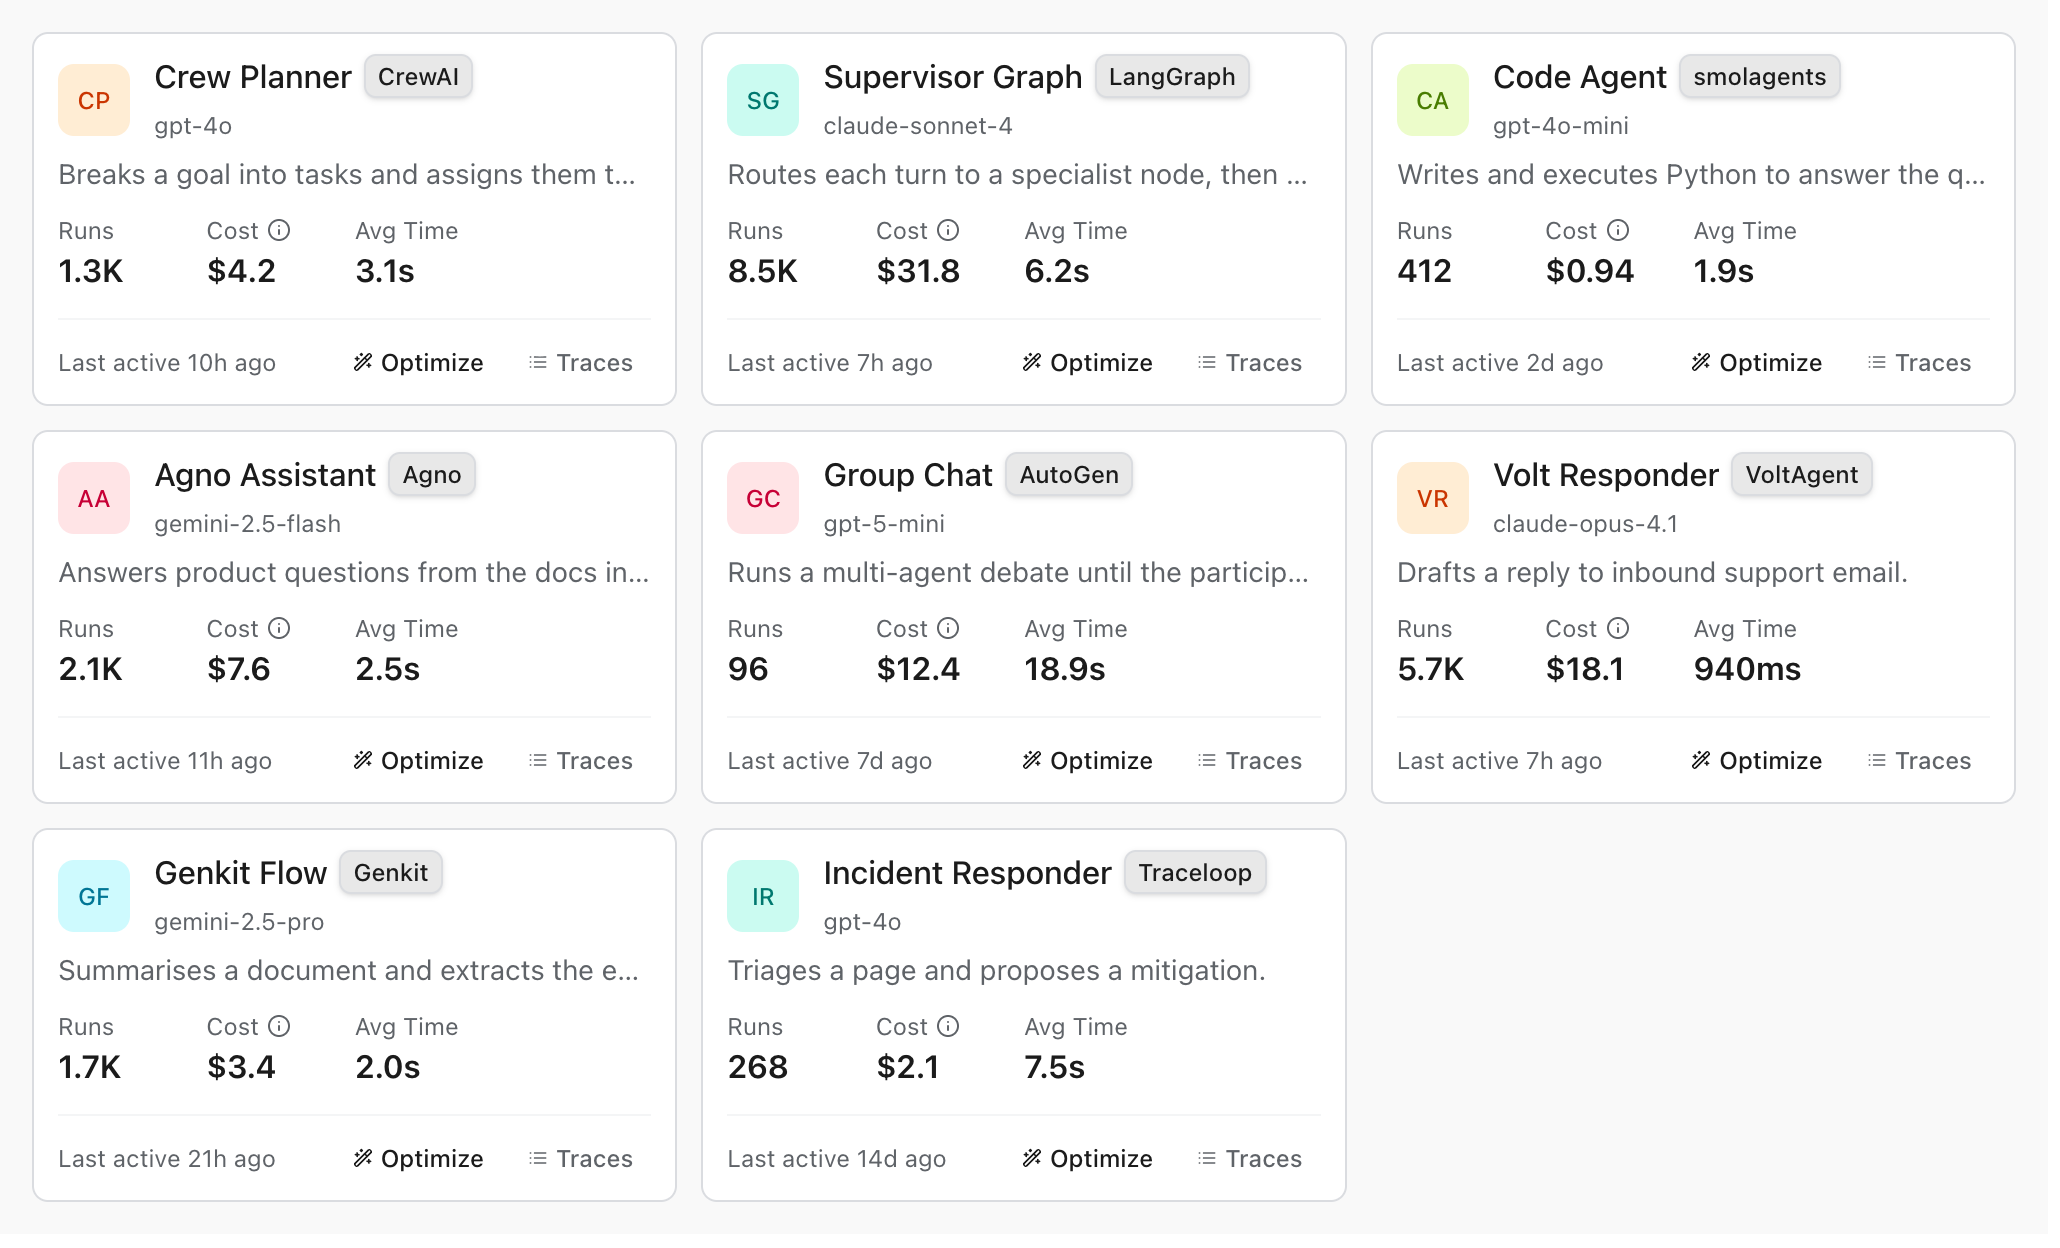

Companies who trust Pydantic Logfire
Boosted.ai, DeepScribe, Airbyte, Evergreen.ai, Fleet AI, Seekr, Polar.sh, Stuut, Alpaca, Motorway, WorkWhile, Sophos, Aignostics, Amboss, Motorola, Epistemix, Nous Research, Pictet, SimpleClub, Tiger Data, Vox Media, ZenHub, Weaviate


Dosu cut agent debugging time 90% and saved $30k a year. Read the case study
SOC 2 Type II · HIPAA · EU data residency · PII scrubbing in the SDK · Self-hosted option Built for the review before the review
The Loop
Trace it. Query it. Improve it.
01 · TRACE
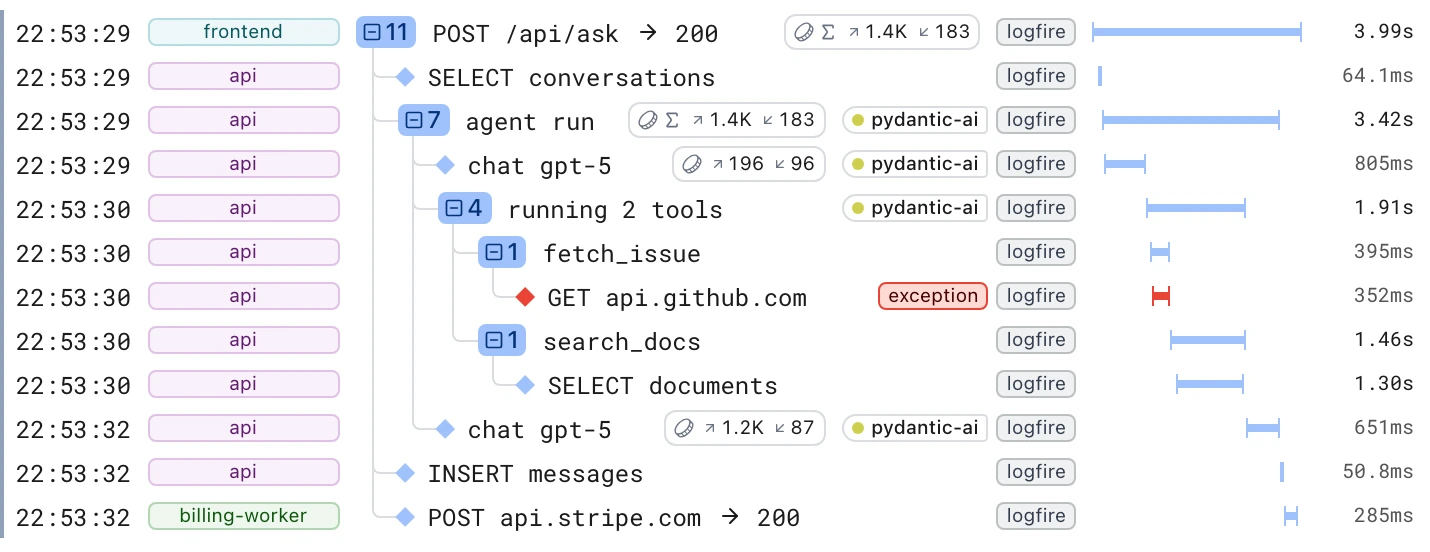
Trace everything
The model call, the tool call, the API hop, and the database query in one timeline.
02 · QUERY
Query anything
Postgres-flavored SQL over every span: in the UI, over MCP, or right on this page.


03 · IMPROVE
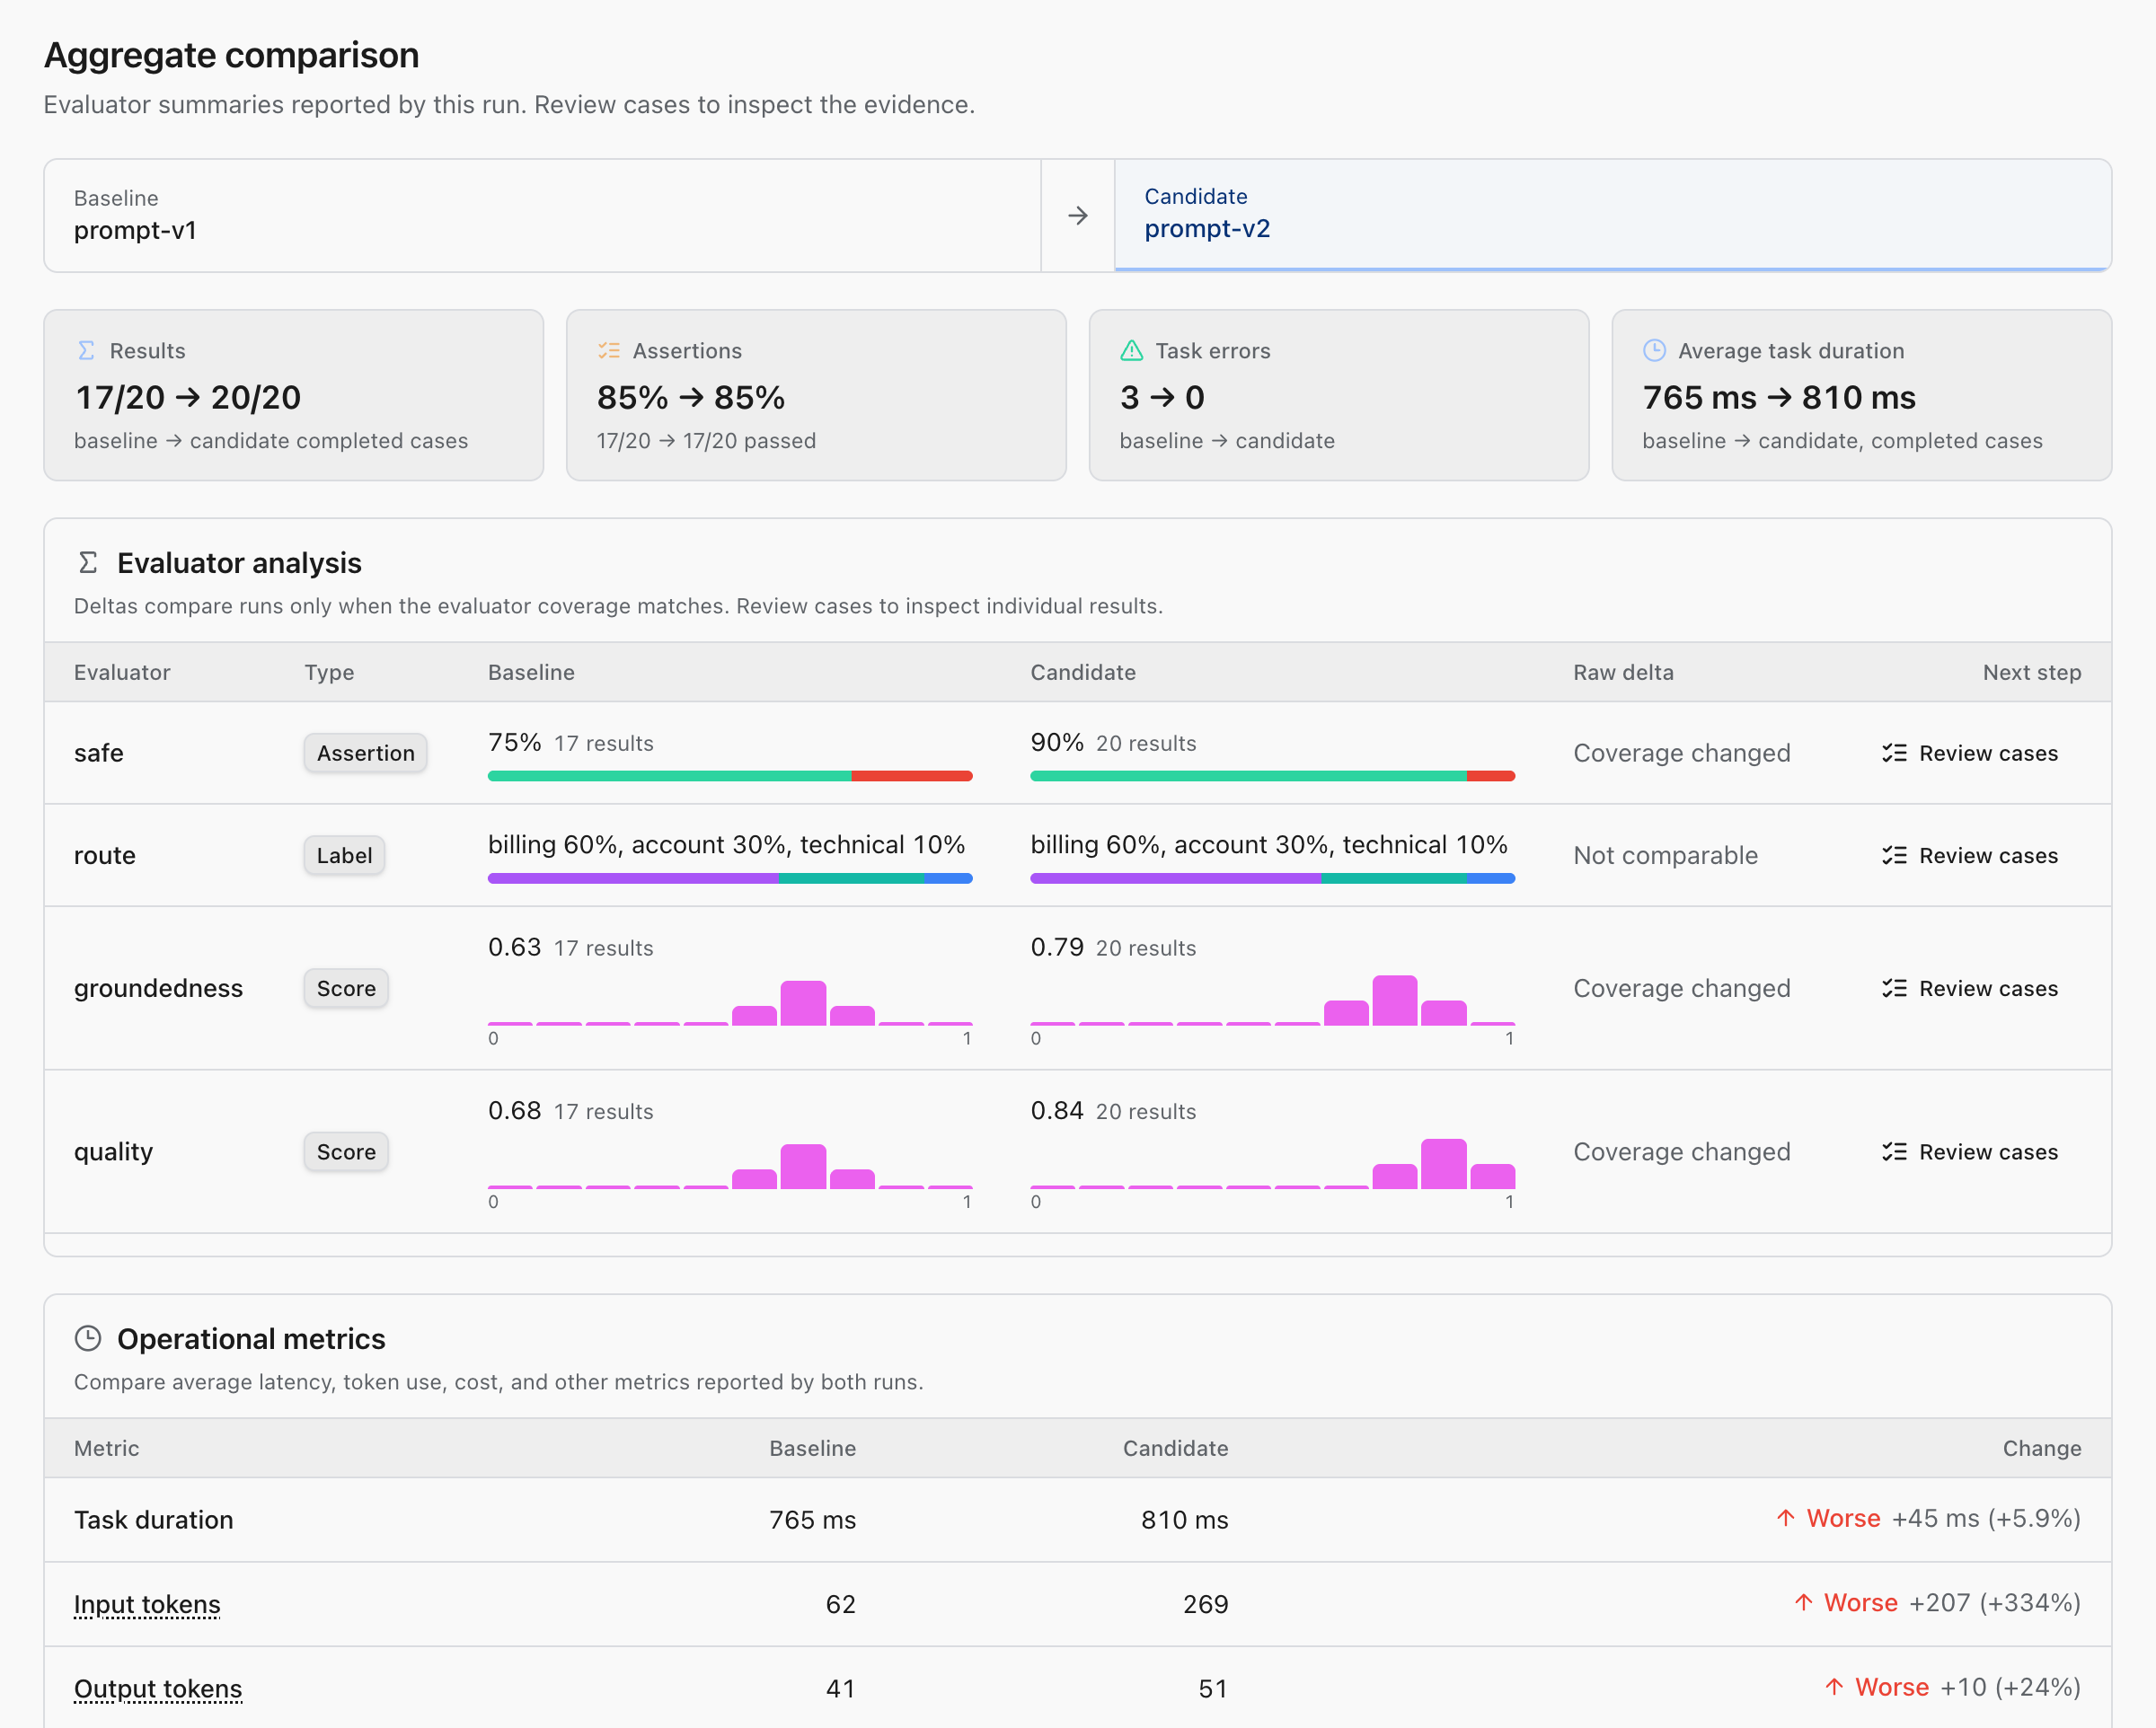
Improve continuously
Evals live inside the trace, and runs diff against each other, so regressions surface before users do.
The Full Picture
The bug is rarely in the prompt
Most teams run one observability tool for the backend and a separate one for the LLM. Production problems hide in the seams between them: a slow vector search that delays context retrieval, an API timeout inside a tool call, a memory leak in a background worker. Logfire keeps the whole request in one trace, so the step that actually failed is on the same screen as the model call that surfaced it.

Evals
Evals that live inside the trace, not in a tool beside it
Airbnb published the clearest public account of evaluating generative AI at scale: read real outputs first, then build evaluators for the failures you actually found, in three layers. Logfire runs all three, and the score lands on the span it scored, beside the database query, the tool call, and the retry that explain it.
01
Programmatic checks
Failures code can identify exactly: malformed JSON, a missing citation, a tool called with the wrong arguments, a response over the length budget. Cheap, deterministic, and they run on every case.
Writing evals02
LLM judges, one job each
For the qualities code cannot check: is the tone right, does the answer follow from the retrieved context, is it actually responsive to the question. A judge with one narrow job is far more reliable than one asked to grade everything.
Datasets and experiments03
Human review as ground truth
People settle the disputed cases and calibrate the judges, so you know how far to trust an automated score before you gate a release on it.
Human reviewThen close the loop: run the same evaluators offline against a dataset to compare a prompt or model change, and live against production traffic to catch what your dataset never contained; production failures become the next dataset case. And because a score is just an attribute on a span, evals and the rest of your telemetry query together in the same SQL, billed as ordinary records with no per-score fee. Read: Do evals the Airbnb way
FusionFire
Query it like a database, because it is one
Your telemetry answers to Postgres-flavored SQL: joins, aggregations, JSON operators, CTEs. The store behind it is FusionFire: our columnar engine built on Apache DataFusion, shaped for wide, deeply nested traces and attributes nobody indexed in advance.
“We migrated from LangSmith to Logfire and the time it took to query our agent traces went down by 96.2%.”
It is built by people who help build DataFusion: a Pydantic engineer sits on the PMC, and the team has hundreds of contributions across DataFusion and Apache Arrow. When the engine needs to be faster, we fix it upstream.
Your coding agent gets the same interface through the Logfire MCP server, and the same telemetry backs AI gateway controls on every model call.
Try it below on a synthetic records table with the real column names. Start with the slowest spans, then ask what is slow inside an agent
run: the answer is the vector search, not the model. Cost is a column too.
| span_name | message | duration |
|---|---|---|
| agent run | agent run: password reset loop | 36.3605 |
| agent run | agent run: invoice copy | 34.4753 |
| agent run | agent run: missing order | 34.0831 |
| agent run | agent run: invoice copy | 33.3635 |
| running tool: lookup_order | running tool: lookup_order (invoice copy) | 30 |
| span_name | avg_seconds | calls |
|---|---|---|
| SELECT documents | 2.04 | 40 |
| chat claude-sonnet-5 | 1.29 | 15 |
| chat gpt-5 | 1.24 | 46 |
| running tool: lookup_order | 0.50 | 14 |
| POST /api/tickets | 0.21 | 40 |
| running tool: search_docs | 0.14 | 40 |
| model | calls | output_tokens | usd |
|---|---|---|---|
| gateway/openai:gpt-5 | 46 | 15881 | 1.00 |
| gateway/anthropic:claude-sonnet-5 | 15 | 6772 | 0.24 |
| span_name | errors | total | exception_type |
|---|---|---|---|
| running tool: lookup_order | 4 | 18 | TimeoutError |
| http_route | p95_seconds | requests |
|---|---|---|
| /api/tickets | 0.33 | 40 |
Integrations
Works with your entire stack
Observability should not require a rewrite. Logfire is built on OpenTelemetry: first-party SDKs for Python, JavaScript/TypeScript, and Rust, and standard OTel for Go, Java, .NET, Ruby, and everything else. That gives Logfire broad support across major AI agent frameworks: their OpenTelemetry spans land in the same project, with purpose-built Agents and LLMs view coverage documented by framework, and 100+ infrastructure components across on-prem and cloud, through prebuilt integrations and the OpenTelemetry Collector's receivers. A Python backend, a TypeScript frontend, and an edge worker land in the same correlated trace. Already running Datadog or Grafana? OpenTelemetry exports to more than one backend at once, so Logfire runs alongside them with no re-instrumentation.
Python
AI / LLM
Pydantic AI OpenAI Anthropic Google GenAI LangChain LlamaIndex LiteLLM Mirascope MCP
Web Frameworks
Databases
Other
JavaScript / TypeScript
Vercel AI SDK ✨ Browser Next.js Express Node.js Deno Cloudflare Workers
✨ Vercel AI SDK has built-in OTel support, so no special integration is needed
Rust
tracing opentelemetry log crate
Built on tracing + OpenTelemetry ecosystem
Any Language via OpenTelemetry
Logfire is built on OpenTelemetry. Any framework with OTel instrumentation works with Logfire without a Logfire-specific SDK. Every span it emits stays searchable in Live and Explore, while recognized AI conventions unlock the purpose-built LLMs and Agents views.
Go Java .NET Ruby PHP Erlang/Elixir Swift C++
Setup guides by stack: AI agents · Python · TypeScript · Rust · Go · Java · .NET · Ruby · PHP · FastAPI · Django · frontend · infrastructure · evals
Five Minutes To First Trace
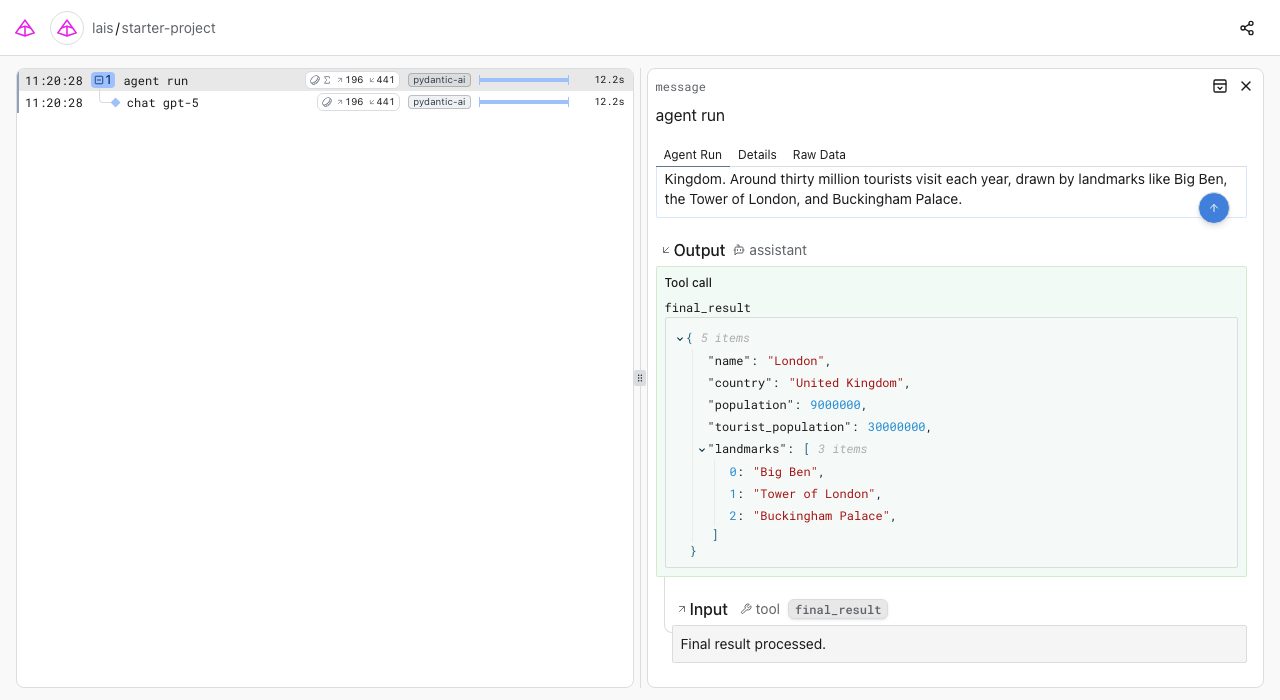
This code produces this trace
Install the SDK, call logfire.configure(), and instrument your framework in one line. The snippet below is a complete Pydantic AI
agent; underneath it is the trace it produced. Click the trace to explore the live view.
import logfire
from pydantic import BaseModel
from pydantic_ai import Agent

logfire.configure()
logfire.instrument_pydantic_ai()


class City(BaseModel):
    name: str
    country: str
    population: int
    tourist_population: int
    landmarks: list[str]


agent = Agent(
    'openai:gpt-5',
    output_type=City,
    instructions='Extract information about the city',
)
result = agent.run_sync(
    'London is home to over nine million people, making it the largest '
    'city in the United Kingdom. Around thirty million tourists visit '
    'each year, drawn by landmarks like Big Ben, the Tower of London, '
    'and Buckingham Palace.'
)

logfire.info(f'Here is the output: {result.output=}')
Enterprise Ready
Ready for your security review
AI applications process sensitive data, so the observability platform watching them gets reviewed hard. SOC 2, HIPAA BAAs, DPAs, and the subprocessor list are ready before you ask for them.
SOC 2 Type II certified
Independently audited controls. A copy of the report is available on request.
HIPAA compliant
Business Associate Agreements are available on Growth and Enterprise plans.
GDPR-ready, EU data region
DPAs, documented subprocessors, and an EU Data Region for customers whose data must stay in the EU.
Runs where your data lives
Managed cloud, dedicated, or self-hosted on the enterprise plan. The SDKs are open source under MIT; the server is closed source.
Customer Outcomes
Teams that switched, with numbers
Behind the case studies, the platform ingests more than 200 billion records and evaluation scores a month.
96%
cut from agent-trace query time after migrating from LangSmith.
General Intelligence Company · case study
Minutes
to trace an agent's reasoning and fix issues that used to mean digging through huge text logs.
Boosted.ai · case study
Your first trace is five minutes away
pip install logfire, logfire.configure(), and you are live. 10 million spans, logs, and metrics free every month, then
$2 per additional million records, with an optional price cap. No credit card required.
Frequently asked questions
How does Logfire help with RAG (Retrieval-Augmented Generation)?
Logfire traces the entire RAG pipeline. You can see the user query, the vector database retrieval latency, the retrieved context chunks, and the final LLM generation on one timeline, so a slow retrieval or an irrelevant chunk is visible next to the generation it fed.
Does Logfire support AI Agents?
Yes. Logfire traces agent runs, model calls, tools, retrieval, and reasoning steps alongside the services and infrastructure around them. Its purpose-built Agents and LLMs views add inventories, run details, token usage, and cost wherever those fields are present in the framework's telemetry.
Is Logfire OpenTelemetry-native?
Yes. Logfire ingests OpenTelemetry signals and preserves OTLP portability, so you can reuse existing instrumentation, forward subsets to your SIEM/warehouse, and avoid vendor lock-in.
How does Logfire handle security, privacy, and PII?
Logfire supports edge redaction through SDKs and collectors, role-based access with SSO, retention controls, and audit logs. For compliance posture, SOC 2, HIPAA, GDPR, and document request details, see the security page.
How does Logfire compare to LangSmith / Langfuse?
LangSmith and Langfuse focus primarily on LLM-layer tracing: prompt management, evaluation, and model behavior analysis. Logfire takes a broader approach: it's built on OpenTelemetry and provides full-stack observability across your entire application, including AI components. If your question is "why did the agent choose that tool?" a prompt-focused tool may help. If it's "why is this request slow, where's the bottleneck, and what's it costing me?", that is what Logfire is built for.
How much data can Logfire handle?
As of mid-2026, Logfire ingests more than 200 billion records and evaluation scores per month. Pricing stays $2 per million records past each plan's included allowance at any volume, and every paid plan includes a price cap option.
What does it cost? Is it really free?
Logfire's free Personal plan includes 10 million logs/spans/metrics per month with no credit card required. Paid plans start at $49/month (Team) and $249/month (Growth), both with additional records at $2/M above their included allowance; Enterprise is custom-priced with volume discounts. Every paid plan includes a price cap option so there are no surprise bills. See the pricing page for full details.
Can I self-host Logfire?
Logfire's SDKs are open source, but the server application and UI are closed source. For teams with data residency requirements, Logfire offers both EU and US hosting regions, and the Enterprise plan includes self-hosted deployment with dedicated support: it deploys into your Kubernetes cluster with our open-source Helm chart. Contact the team for details.
More on what AI observability is and how it differs from APM: LLM observability, explained
Compare Logfire: LangSmith Langfuse Arize AX Datadog Braintrust Sentry SigNoz all alternatives