Your CrewAI multi-agent workflow that researches, outlines and drafts an article used to take 90 seconds. It now takes four minutes. Nothing is obviously broken. No alerts fired. The LLMs page says cost and latency are flat. The agent run page says the turn count is normal. The Services view says no downstream dependency is slow.
Something is degrading, but you do not know what to look at.
What's new
- Browse your metrics in three steps: pick a namespace, pick a metric, see what you can break it down by. No SQL required.
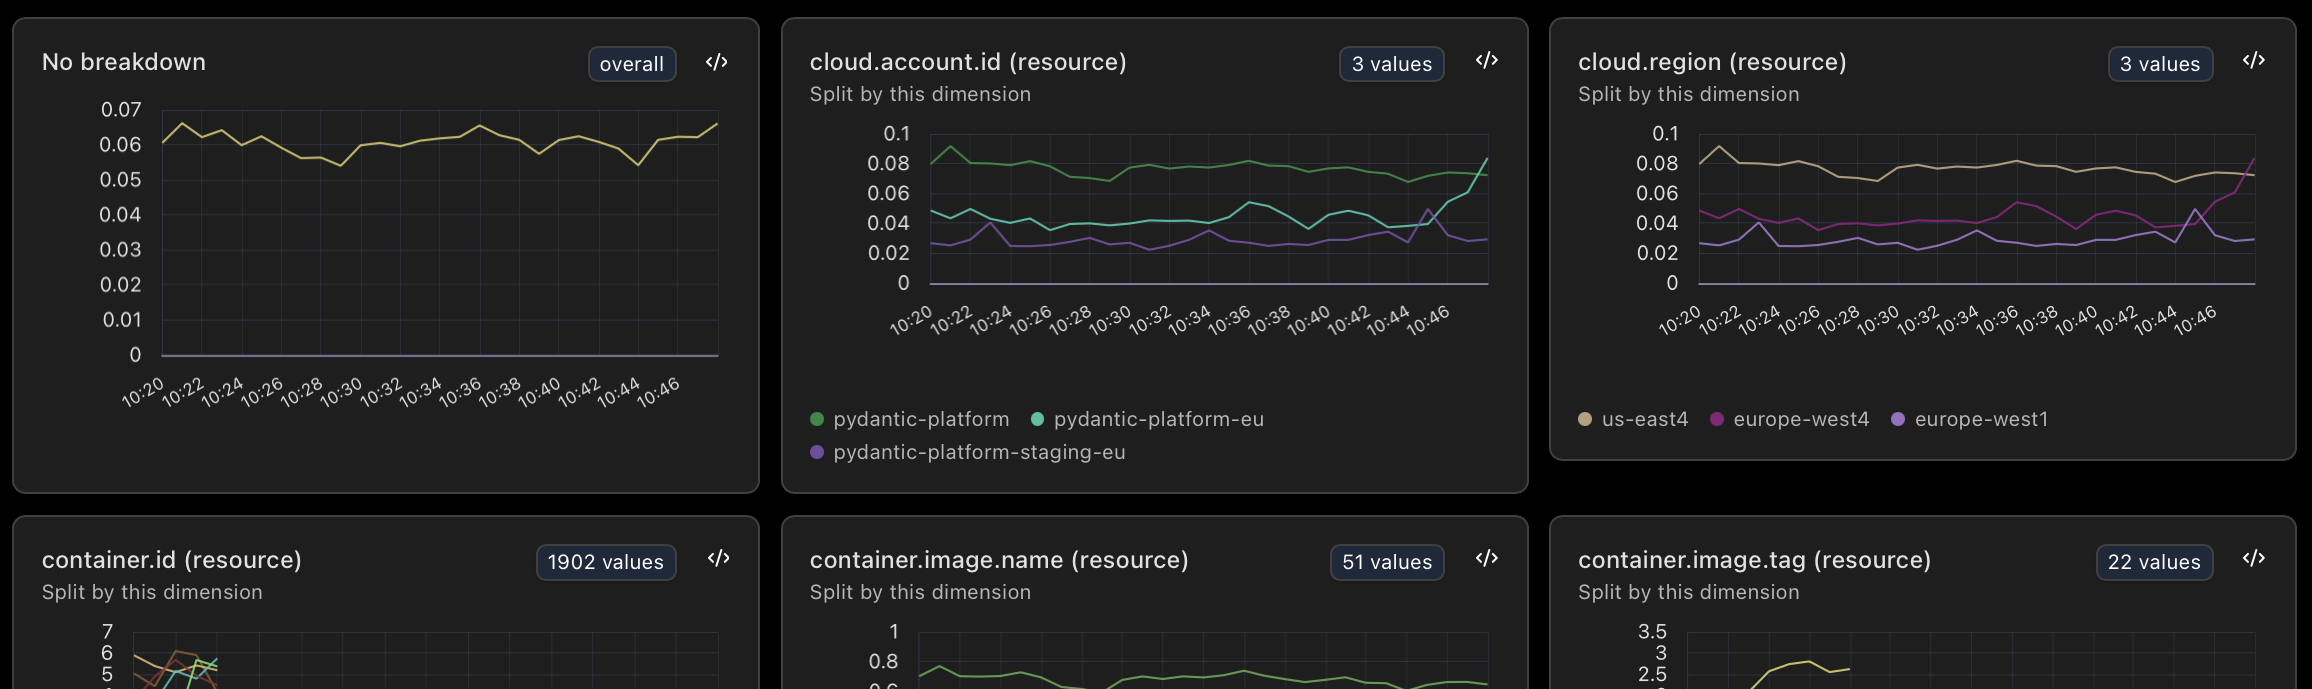
- See what every breakdown would look like before committing to it: each dimension shows up as a small chart with its cardinality.
- When the wizard finds the metric you need, jump into the full SQL editor with the query already populated. Or jump to the live view to see traces that emitted that metric.
- The metrics you actually look at stay at the top for one-click access. Stale metrics are hidden so the picker reflects what is live now, not what stopped emitting last quarter.
Why this matters
The hardest part of metrics is the first ten minutes. You know the metric you want exists somewhere, but you cannot remember what it is called, you do not know which labels are useful, and the only way to find out is to write a query, look at the chart, change the query, look at the chart again.
Plenty of tools let you explore metrics without writing PromQL. Our take is aimed at developers who already know SQL: a wizard for discovery, full SQL for the real work, and a button on every card that hands you the query so you can graduate without retyping anything. No new query language to learn for one part of the product and a different one for another.
In our scenario you browse the system namespace. Nothing unusual. You browse http. Nothing unusual. You browse a custom namespace for the retrieval tool, and find a retrieval.latency_seconds metric where the average is flat but the p99 has crept from 200ms to 8 seconds over six days. Break down by tool_name. One tool. Break down by index_segment. The slow path fires when the underlying index gets fragmented. Reindex. Workflow back to 90 seconds. The trace that explained it is in the live view.
All of this data is available to you and your closest friends: Claude, Codex, Gemini, Pydantic AI, and more via MCP and our RESTful query endpoints.
How it works
Step one groups metrics by namespace, which is the prefix before the first dot. http.server.duration lives under http, system.cpu.utilization lives under system, anything without a dot ends up in Everything else. The grouping is purely structural. No instrument list, no metadata file.
Step two lists the metrics inside that namespace, with a sparkline next to each so empty metrics are obvious before you click them. We hide metrics that have no data in the current window, so the picker shows what is live now, not what stopped being emitted last quarter.
Step three renders a small chart per dimension on the metric, with high-cardinality cases linking out to the full breakdown in Explore.
Aggregations default sensibly by metric kind (averages for gauges, sums for sums, the rest available from the dropdown).
Getting started
The Metrics explorer is live for every Logfire project.
One trap worth flagging up front: if you're sending host metrics from both Logfire's system-metrics integration (SDK) and an OpenTelemetry Collector running hostmetricsreceiver, both write into the same system.* namespace. Run only one per host or you'll double-count CPU, memory, and the rest.
Full reference, including the catalog of automatically-collected metrics: the Metrics explorer docs.
Not using Logfire yet? Get started. The free tier includes usage up to 10 million spans, our AI Gateway, and so much more.
