Here’s a confession: we spent weeks building over 40+ MCP tools for Logfire, carefully crafting parameter schemas and writing descriptions that would guide models to use each tool correctly. Then we added a single exec tool that lets the agent write Python, and it immediately handled tasks our hand-crafted tools couldn’t.
This is a story about how that happened, why we probably should have seen it coming, and why we still keep the old tools around.
Act 1: The Tool Factory
We started the Logfire Remote MCP server the way everyone does. Logfire is an AI observability platform, built on OTel -- spans, traces, metrics, alerts, dashboards. We identified the things users do most often and wrapped each one as an MCP tool. One for SQL queries. One for listing alerts. One for creating dashboards. We shipped it and it worked.
Then we kept going. Dashboard tools alone grew to over twenty — create, update, delete, add panels, remove panels, manage variables, reorder groups. At that point we didn’t have an MCP server, we had an API with delusions of grandeur.
The problem is almost mechanical: every tool needs a detailed description so the model picks it correctly, but those very descriptions eat the context window the model needs to actually think. We were spending more tokens describing tools than using them. Cloudflare hit the same wall with their 2,500-endpoint API — a full MCP implementation would have required 1.17 million tokens before a single user message was even processed. Our scale was smaller, but the trajectory was the same.
Models were wasting turns on unnecessary discovery calls, calling tools they didn’t need, and generally behaving like someone handed a TV remote with 40 unlabeled buttons. Every new Logfire feature would need another tool. Every new tool would crowd the model’s context and make tool selection worse.
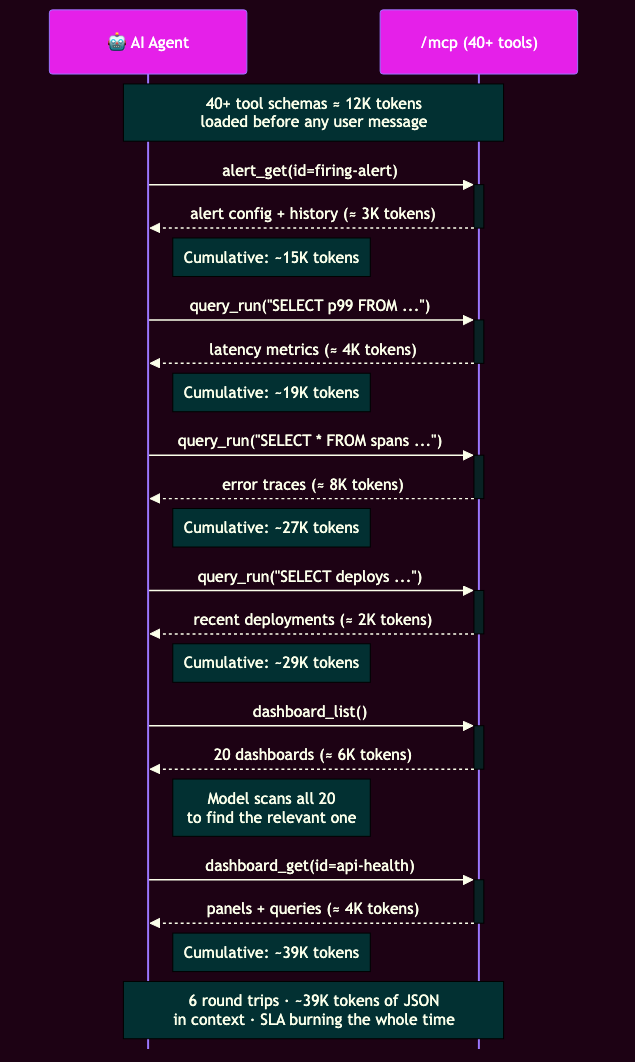
Here’s what that looks like in practice. A production alert fires at 3am — your agent needs to check the alert, pull latency metrics, fetch error traces, find recent deployments, and locate the right dashboard. Six sequential round trips, each returning JSON the model has to read, all while your SLA is burning!
Act 2: What If We Just Let It Write Python?
Meanwhile, we’d been building Monty — a minimal Python interpreter written in Rust that lets agents write and execute code safely. LLMs are trained on oceans of code; they’re remarkably good at writing programs but often mediocre at playing twenty questions with a massive tool menu.
We weren’t the only ones noticing. Cloudflare collapsed thousands of endpoints into just two tools — search() and execute() — consuming around 1,000 tokens total. Anthropic published the same insight from the model side. The pattern was obvious: stop making the model pick from a menu, let it write a program.
So we built a second MCP endpoint with three tools total. exec takes Python code and runs it in a Monty sandbox. help lets the agent discover available functions and their signatures. results retrieves output from previous executions. That’s it. Three tools instead of forty-plus.
That same 3am incident collapses into a single exec call. The agent writes something like this:
import asyncio
from datetime import timedelta

# fetch the alert first — we need its firing time to scope the queries
alert = await lf_alert_get(alert_id="firing-alert")
fired_at = alert["last_run"]  # datetime | None
since = fired_at - timedelta(hours=1)

metrics, traces, deploys = await asyncio.gather(
    lf_query(query="SELECT p99_latency, service FROM metrics", start_timestamp=since),
    lf_query(query="SELECT * FROM spans WHERE level = 'error'", start_timestamp=since),
    lf_query(query="SELECT * FROM deployments", start_timestamp=since),
)

# find which deploy correlates with the latency spike
spike_start = next(m["timestamp"] for m in metrics["rows"] if m["p99_latency"] > 500)
culprit = next(
    (d for d in deploys["rows"] if d["deployed_at"] <= spike_start),
    None,
)

# get the dashboard with the relevant panels
dashboards = await lf_dashboards(search="api")
api_dash = next(d for d in dashboards["dashboards"] if "api" in d["dashboard_name"].lower())
dashboard = await lf_dashboard_get(dashboard_slug=api_dash["dashboard_slug"])

error_services = {t["service"] for t in traces["rows"]}
panels = dashboard["spec"]["panels"] or {}
relevant = {name: p for name, p in panels.items() if p["spec"]["plugin"]["spec"].get("service") in error_services}

print(f"Alert: {alert['name']} (fired at {fired_at})")
print(f"Culprit: deploy {culprit['id']} at {culprit['deployed_at']}")
print(f"Affected: {', '.join(error_services)}")
print(f"Dashboard: {api_dash['dashboard_name']} ({len(relevant)} relevant panels)")
The code above was generated by an LLM on demo instance — lightly edited for clarity.
Monty runs this server-side — the same six API calls happen in parallel, but intermediate data never leaves the sandbox. Only the printed summary crosses the wire:
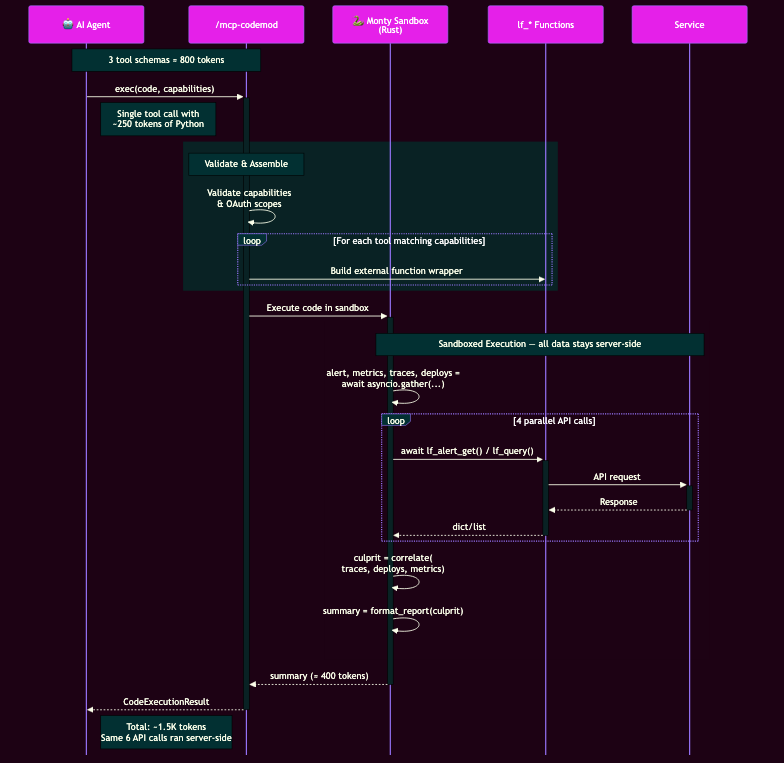
The trick: every one of our 40+ existing tools is wrapped as an async function inside the sandbox. The agent composes them with loops, conditionals, variables, and actual computation. Where sequential tool calling is stochastic ("hmm, which tool next?"), sandboxed execution is planning plus deterministic compute.
There's a deeper design problem that code solves. With traditional tools, every new filtering need demands a new parameter — filter dashboards by name? Add name_contains. By date range? Add created_after. By tag? Add tags. Nothing beats SQL - you're rebuilding a query language one parameter at a time, and you'll never cover every combination users actually need. Take it far enough, and you're just building a worse version of SQL. Let agents write the filter logic itself: a list comprehension, a date comparison, a regex match — whatever the task requires, without anyone having to anticipate it in a tool schema.
This also changes where data lives during execution. In traditional tool calling, every intermediate result — a list of 100 dashboards, a batch of alert statuses — travels back to the client as a tool response. The model has to "read" that JSON, reason about it, and decide the next step. It's like downloading an entire database table to run a WHERE clause on the client. With exec, intermediate results stay server-side in the sandbox's memory. The agent's script filters, aggregates, and composes data using actual computation, and only the final result crosses the wire. Fewer tokens sent back means more context left for reasoning.
The results were immediate. A root-cause analysis task that normally requires multiple sequential round-trips — compare data for various services, evaluate alerts, find the right dashboard panels — collapsed into a single script using asyncio.gather(). Execution time dropped. Token usage fell. Anthropic has reported reductions from 150,000 tokens down to 2,000 in similar setups — a 98.7% cut.
Act 3: Where It Breaks
Before this turns into a victory lap: the exec tool has its own friction.
Models frequently make what you might call "vibe coding" errors — confusing dot notation with bracket notation for dictionary values, forgetting to await async functions, or generating empty functions with helpful comments like "Your logic goes here." They're writing Python the way a confident intern would: fast, mostly right, occasionally catastrophic.
Monty is also still young. It already supports closures, comprehensions, asyncio, and standard library modules like datetime and json, but features like class definitions and match statements are still on the roadmap. We're building the plane while flying it, which is fine as long as you know where the wings end.
Security is the part we're most deliberate about. Monty starts with zero capabilities — no filesystem, no network, no environment variables. Every interaction with the outside world must go through external functions that we wrote, we control, and we can audit. This is far safer than general-purpose runtimes, and because Monty is embedded in the parent process, it starts in under a microsecond — thousands of times faster than a Docker container.
Act 4: Don’t Trust Us, Trust Your Evals
Shortly after shipping the exec tool, we built an eval framework with dozens of test cases using Pydantic Evals. If you’re considering this pattern, you need to test "behavioral contracts," not just final outputs.
We use span-based evaluation (integrated with Logfire) to look inside the agent’s process. Using the SpanTree API, we can verify that the agent reached its answer the right way—did it discover the schema efficiently? Did it write a reasonable query on the first attempt? Did it use the expected sequence of tools?
We found that exec wins decisively for multi-step composition, while traditional tools are still faster for simple lookups with no discovery overhead. Where the crossover falls depends on your specific task distribution.
Act 5: What Comes Next
MCP itself is evolving quickly. The pieces that matter most to this pattern:
- Interactive UIs: Text alone is often insufficient for complex data. The spec is standardizing how tools can return rich HTML interfaces — like interactive charts — rendered in sandboxed iframes.
- Human-in-the-Loop: Elicitation lets a server pause and ask the user for a decision mid-operation. Your agent can now ask before it deletes something.
- Async Tasks: Operations that take hours get a "call-now, fetch-later" primitive with progress tracking, so agents don't have to sit and wait.
We spent weeks hand-crafting 40+ tools so models could point and click. Turns out they'd rather just write code. Fair enough — so would we.
The direction is consistent: fewer tools, more expressive execution. The tools told us they were the wrong abstraction. We listened.
Resources
- Monty on GitHub — the minimal Python interpreter in Rust powering the exec tool
- Logfire Remote MCP Server — setup guide for connecting your agent to Logfire
- Logfire MCP Integrations — instrumenting MCP clients and servers with OpenTelemetry
- Pydantic Monty blog post — deep dive into why Monty exists
- Pydantic Evals — the evaluation framework we use to test agent behavior
