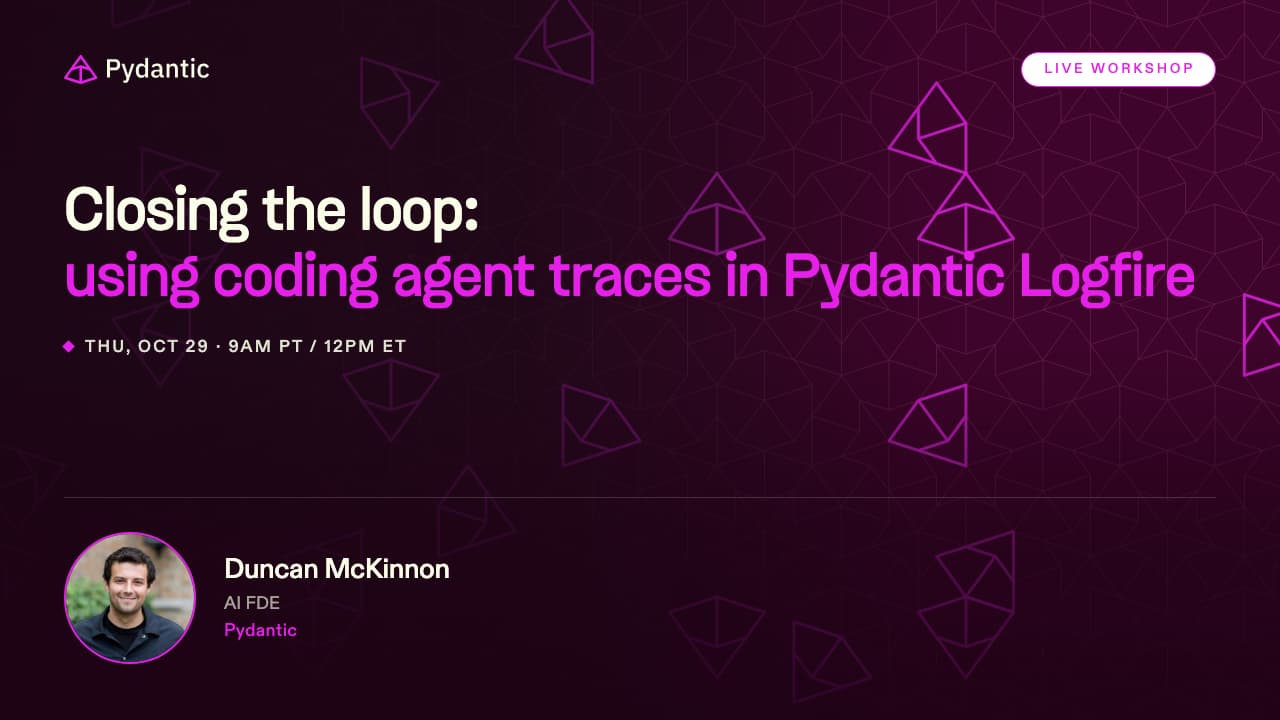
Closing the loop: using coding agent traces in Pydantic Logfire
Coding agents do real work every day, and almost none of it gets recorded. This recording shows how to trace any coding harness into Pydantic Logfire, then query those traces to compare harnesses on cost, output and quality.
Trace any coding harness into Logfire and use the data to compare cost, output and quality.
Overview
- 30 min
- On demand replay
- Online event
- Free
Speaker



About this recording
Coding agents do real work every day, and almost none of it gets recorded. The commit and the PR survive, but how the agent got there doesn't. When a result is bad, you have few good options. You can ask an agent to fix it without showing it where things went wrong. You can rewrite your instructions without knowing what was off. Or you can switch tools without knowing what you're giving up.
Every question you'd want to ask is answered in the traces. Which harness is best at code review? Would a cheaper model give the same results? Did the agent get confused by its tools and burn two million tokens? Is it re-exploring the same tasks every session?
In this workshop, Duncan McKinnon sets up tracing for a coding harness into Pydantic Logfire. He walks through what a trace holds, from the full session down to each turn, model call, tool run and subagent. Then he puts that OpenTelemetry data to work by querying it with the Logfire MCP server, and builds the metrics you should use to evaluate your harness.
What you'll learn
- How to capture traces from your coding harness, and what's inside them
- How to compare harnesses on cost, output and quality using real data, not vibes
- How to turn traces into better skills, evals and self-improvement loops
Watch the recording
Tell us where to send Pydantic updates and unlock instant access to this replay.
You're all set
Your request was received. You can close this page.
We couldn't open the recording
Please go back and try again in a moment.
Explore Logfire
Explore our open source packages
