

Instrumenting a database, a queue, and a web server used to mean three separate dashboards, three alert setups, and three sets of docs to find. The integrations catalog collapses that into one motion: a standard dashboard, health alerts, setup instructions, and telemetry detection for databases, caches, queues, streaming systems, web servers, metric collectors, and GPU hardware.
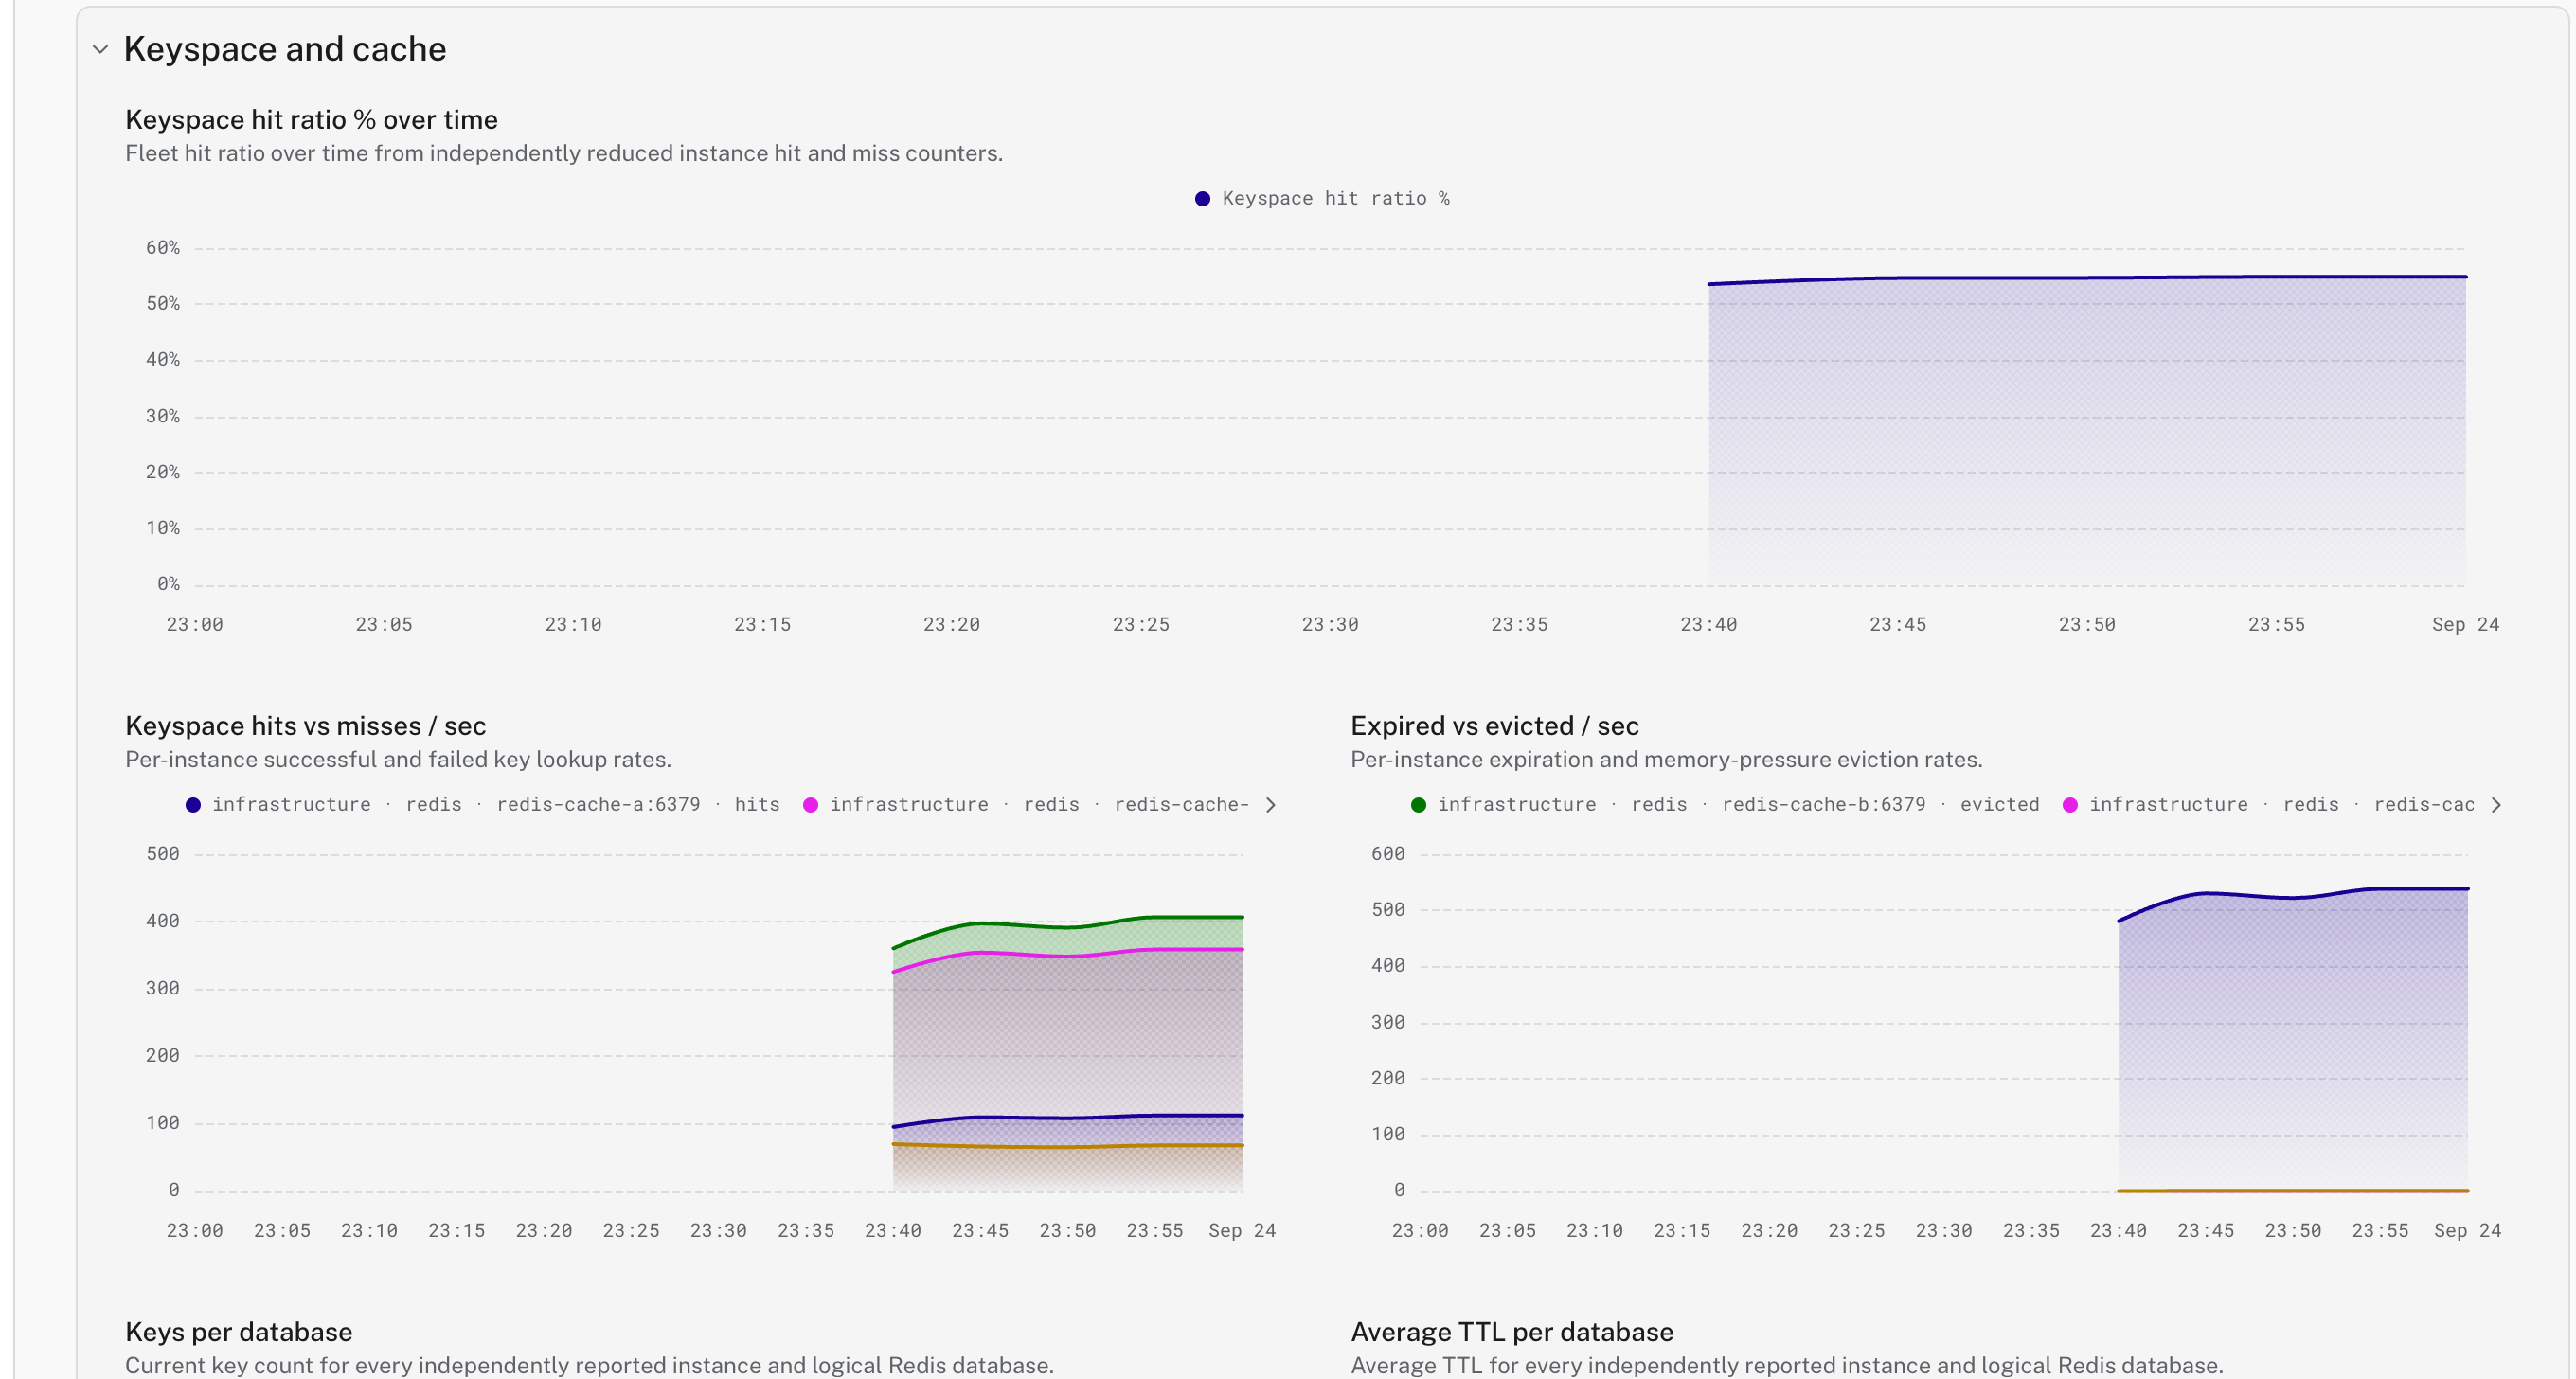
Detect and Install checks recent project telemetry and installs the matching integrations in a few clicks. Recommended alerts start active, diagnostic alerts start inactive, and alerts do not notify anyone until you attach a notification channel. Logfire maintains installed dashboard and alert definitions while preserving your channel and enabled-state choices.
Where to find it: Integrations in your project sidebar. See the infrastructure integrations guide.