

A pod keeps restarting. Find it in Pydantic Logfire's Kubernetes inventory, inspect its Events, then read its container logs. Your resource scope, time range, and environment stay with you as you switch between Overview, Logs, and Events.
Logs and Events are experimental; Findings are already available in the Kubernetes inventory.
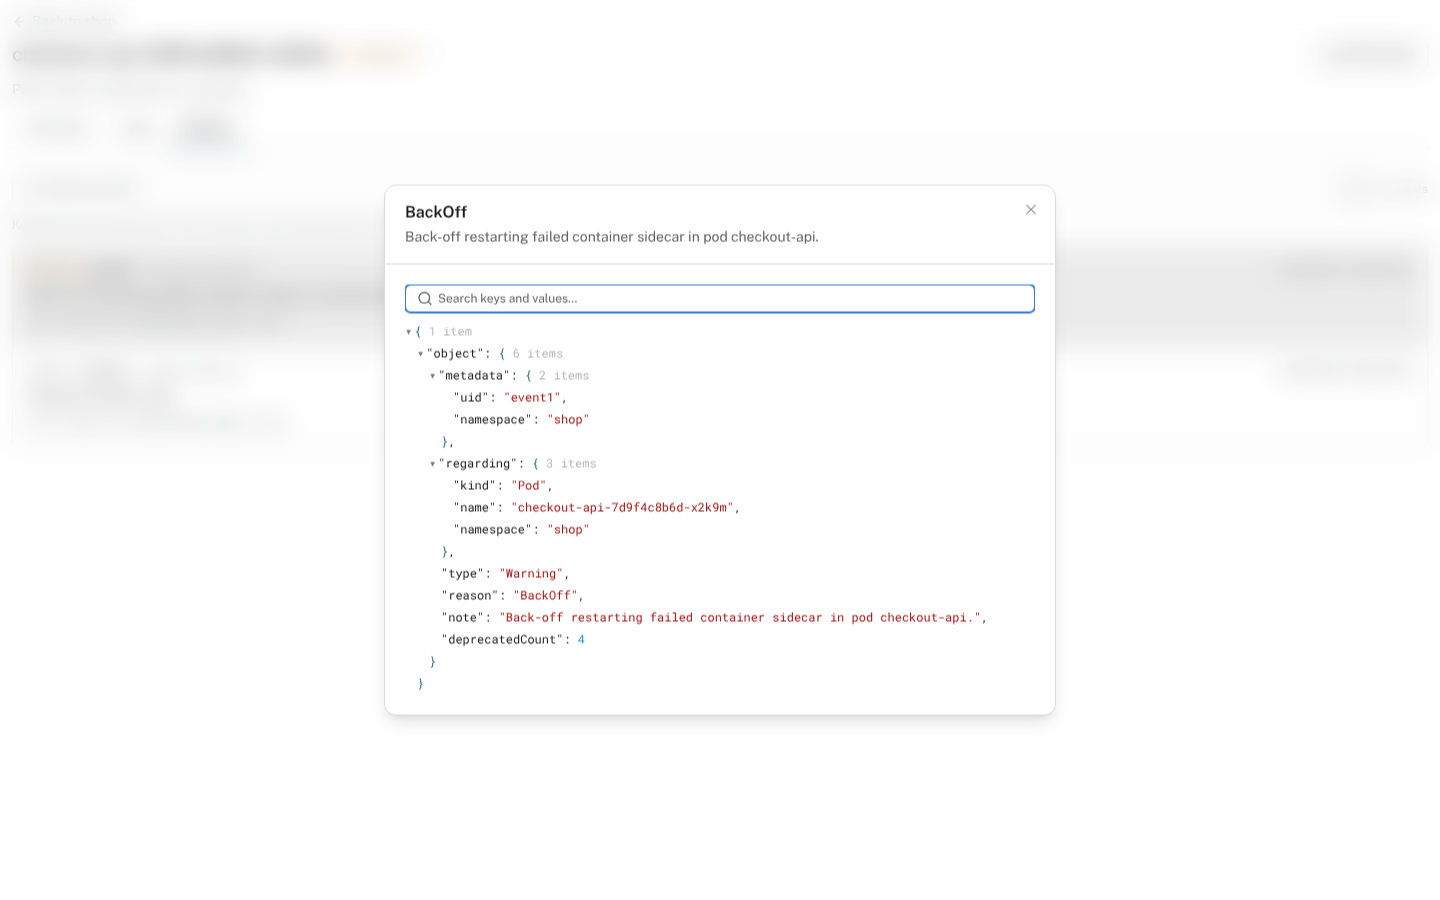
Events for the resource you're investigating
Open Events at the fleet, cluster, namespace, node, workload, or pod level. Each event shows its type, reason, message, affected resource, and reported occurrence count when available. Search for a reason such as BackOff or an object name, then open the event to inspect its original structured body.
Container logs, with context intact
Search messages, filter by severity, and choose a container on a pod's Logs tab. Open a log row for the original body and attributes; long messages remain previews until you request the full record.
Live tail follows incoming records. Pause to inspect a fixed window, or scroll back without the list pulling you to the newest row. When new records arrive while you're scrolled away, the new-row indicator offers Resume to return to live output.
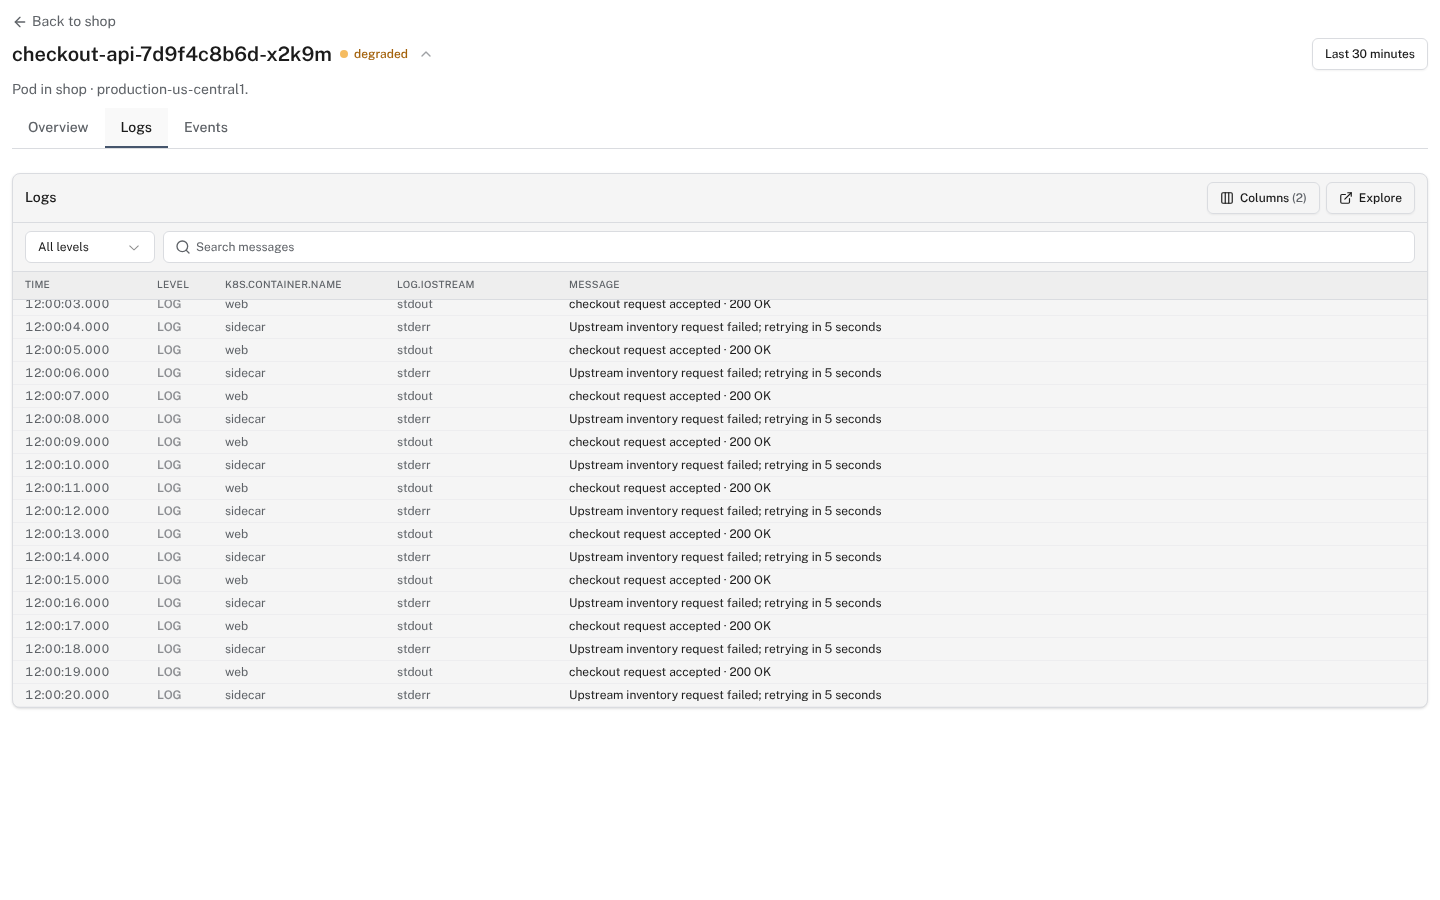
Screenshots use a synthetic Kubernetes workload.
Find resources that need attention
The Nodes, Workloads, and Pods inventory tabs show finding counts. Select With findings to query affected resources across the fleet, including those beyond the initially loaded rows.
- Nodes: not ready, memory or disk pressure, or at least 80% of allocatable CPU or memory in use.
- Workloads: deployments with fewer available replicas than desired, or jobs reporting failed pods.
- Pods: pending or failed, or reporting at least three cumulative container restarts. This is the count reported by Kubernetes, not the number of restarts in the selected range. Kubernetes can reset it after a node restart.
Finding counts use metric samples from the final 15 minutes of the selected range, or the whole range if it is shorter. With findings checks the latest 15 minutes at the time of the request, regardless of the selected range. Historical counts can therefore differ from the filtered rows. Missing metrics mean a condition cannot be checked, not that the resource is healthy. Events remain separate records that can help explain a finding.
Where to find it: Kubernetes in your project sidebar. Logs and Events require Early access through a Growth or Enterprise organization, or a self-hosted deployment. Open Settings → Early access, click the flask button labeled Show experimental features, and enable Infrastructure logs. Complete the terms or notice dialog if prompted, then open Kubernetes or a resource's detail page. Findings do not require Early access.
Follow the Kubernetes monitoring setup guide to send metrics, pod logs, Kubernetes Events, and resource identity to Logfire. A metrics-only installation does not populate Logs or Events. See the Kubernetes view guide for inventory and Findings.