

A slow page report and a clean backend trace don't always agree: the backend did its job in milliseconds, and the user still waited. Frontend observability closes that gap. It's now part of Logfire, tracking page-load latency, Core Web Vitals, slow resources and API calls, and browser errors for each registered application, filterable by page, domain, country, browser, operating system, or device. Open the matching records in Live view and see exactly what the user's browser did.
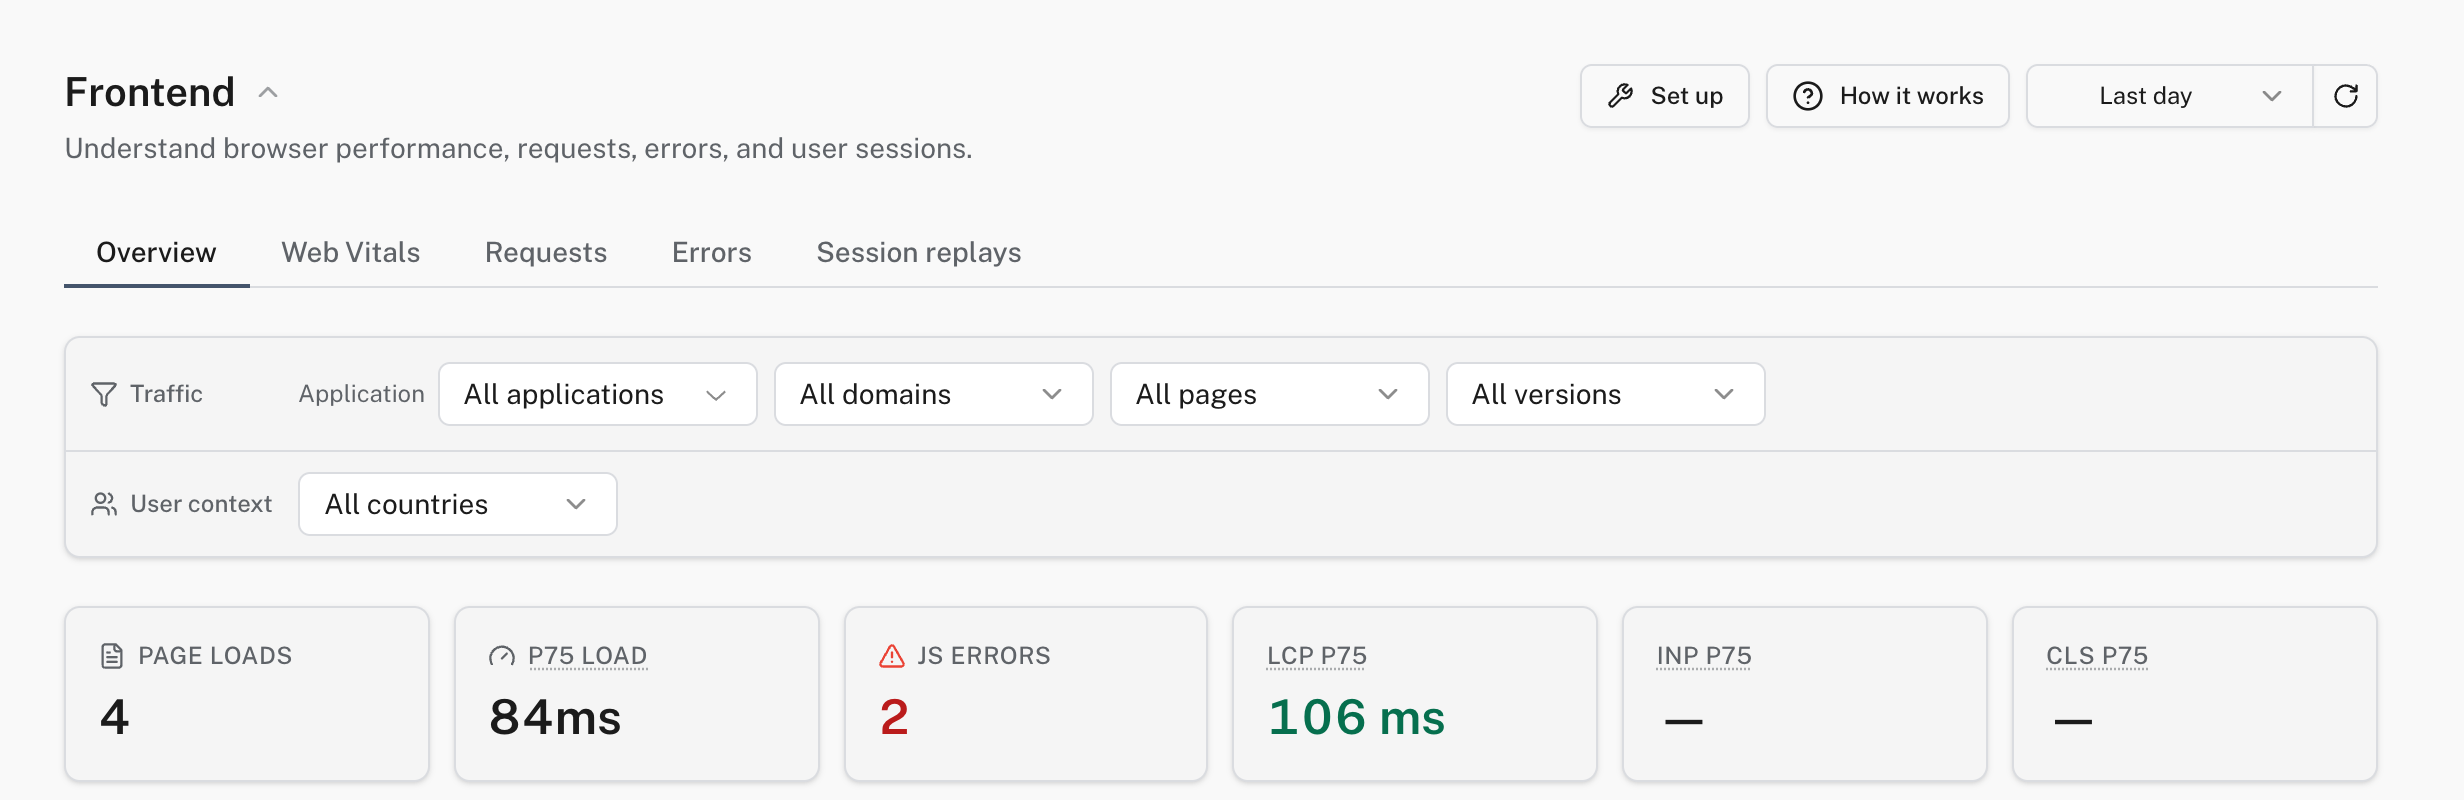
Register a frontend application to generate its browser setup snippet. The application's token can only send telemetry for that application; it cannot read project data or report as another service.
Where to find it: contact Pydantic for access, then open Project settings → Frontend applications in your project. See the frontend observability guide.