This piece is a guest post from Vstorm.
A while back, one of our agents handed a customer a wrong answer with total confidence. No exception. No failed test. The logs were clean. It took the better part of a morning to work out what had happened: the model had called the right tool with the wrong argument three steps upstream, then reasoned smoothly on top of the bad result all the way to a fluent, plausible, incorrect conclusion.
That morning is the whole argument for this post. Agents are still software, so the fix isn't a new philosophy. It's the same engineering discipline pointed at a harder target: making a non-deterministic system observable enough that you can read what it did instead of guessing. That layer is AI agent observability, and if you're shipping agents to production, it's not optional.
The failure mode traditional monitoring can't see
Your existing stack assumes deterministic code paths. An HTTP handler that returns the same response for the same input is easy to monitor. Agents break that assumption. The same query can produce a different tool-call sequence, different intermediate reasoning, and a different final output on consecutive runs.
Worse, agents fail without tripping any alarm. Infinite loops, wrong tool selection, context abandonment, and quality that degrades over a long reasoning chain rarely throw an error. The exception you're used to catching is replaced by a hallucination that looks completely confident.
Two consequences follow. The unit of debugging moves from the request to the session: isolated traces mean nothing until shared identifiers connect them into one readable execution graph. And cost and latency now compound step by step, so without per-step LLM cost tracking you find out what an agent costs when the invoice arrives.
How teams cope today, and why it doesn't hold
Most teams reach for what they already have. It half-works, which is the dangerous part.
The first instinct is to point traditional APM at the problem. Conventional request monitoring captures latency and error rates, but without an AI/agent integration it lacks the vocabulary for tokens, prompts, tool calls, or eval results, so it's blind to the signals that actually matter. The second instinct is print statements and log spelunking, fine for a demo and hopeless once you're past a few hundred runs a day. The third is an LLM-only tool that traces prompts and completions.
That last one gets closest and still misses by default. What separates an agent from a chat completion is the loop of calling tools, observing results, and iterating. An LLM-focused integration may capture model and tool spans automatically, while database and other application work requires application-level instrumentation.
What the AI agent observability layer must capture
Before naming a tool, it's worth being precise about the target. A useful observability layer for agents has to capture five things:
- The agentic loop as spans. Plan, call tool, observe, iterate, each as its own step with a duration and an error surface.
- One correlated, full-stack trace. The LLM call, the tool execution, the database query, and the business logic on a single timeline, so you can tell whether the fault is in the AI or the backend.
- Per-step cost and latency. Token usage and spend attached to each step, not summed at the end.
- Session correlation. Parent and child spans across multi-agent handoffs, so an orchestrator and its workers read as one graph.
- A portable standard underneath. Instrumentation built on OpenTelemetry, so you avoid lock-in. OpenTelemetry has merged semantic conventions for LLM workloads, which gives OpenTelemetry agent tracing standard definitions to build on.
Here's the same idea as a coverage map. One tool having more logos isn't the interesting part. These signals belong on one timeline rather than stitched across four.
| Area | Traditional tool | Pydantic Logfire |
|---|---|---|
| API monitoring | Sentry / Datadog | Yes |
| Database queries | Datadog | Yes |
| Redis / cache | Datadog | Yes |
| Background tasks | Datadog | Yes |
| LLM calls (OpenAI, Anthropic) | LangSmith | Yes |
| AI agents (LangChain, Pydantic AI) | LangSmith | Yes |
| System metrics | Datadog | Yes |
Doing it with Pydantic Logfire
Logfire is an AI-native observability platform from the Pydantic team, built as an opinionated wrapper around OpenTelemetry. The part that matters for adoption is that it doesn't ask for a rewrite. You initialize it and instrument your agent at the entry point, without touching your agent code:
import logfire

logfire.configure()
logfire.instrument_pydantic_ai()
From there, a few things come for free. You get conversation replay, tool-call inspection, and token and cost breakdowns, because Logfire automatically detects the GenAI semantic conventions in the spans. That covers the per-step LLM cost tracking from the section above without custom work.
The full-stack angle is the real differentiator. When you're debugging an agent you're really asking three questions: was it the model, the tool, or the backend? An LLM-only tool can only answer the middle one. Because Logfire traces the whole stack, all three land on the same trace.
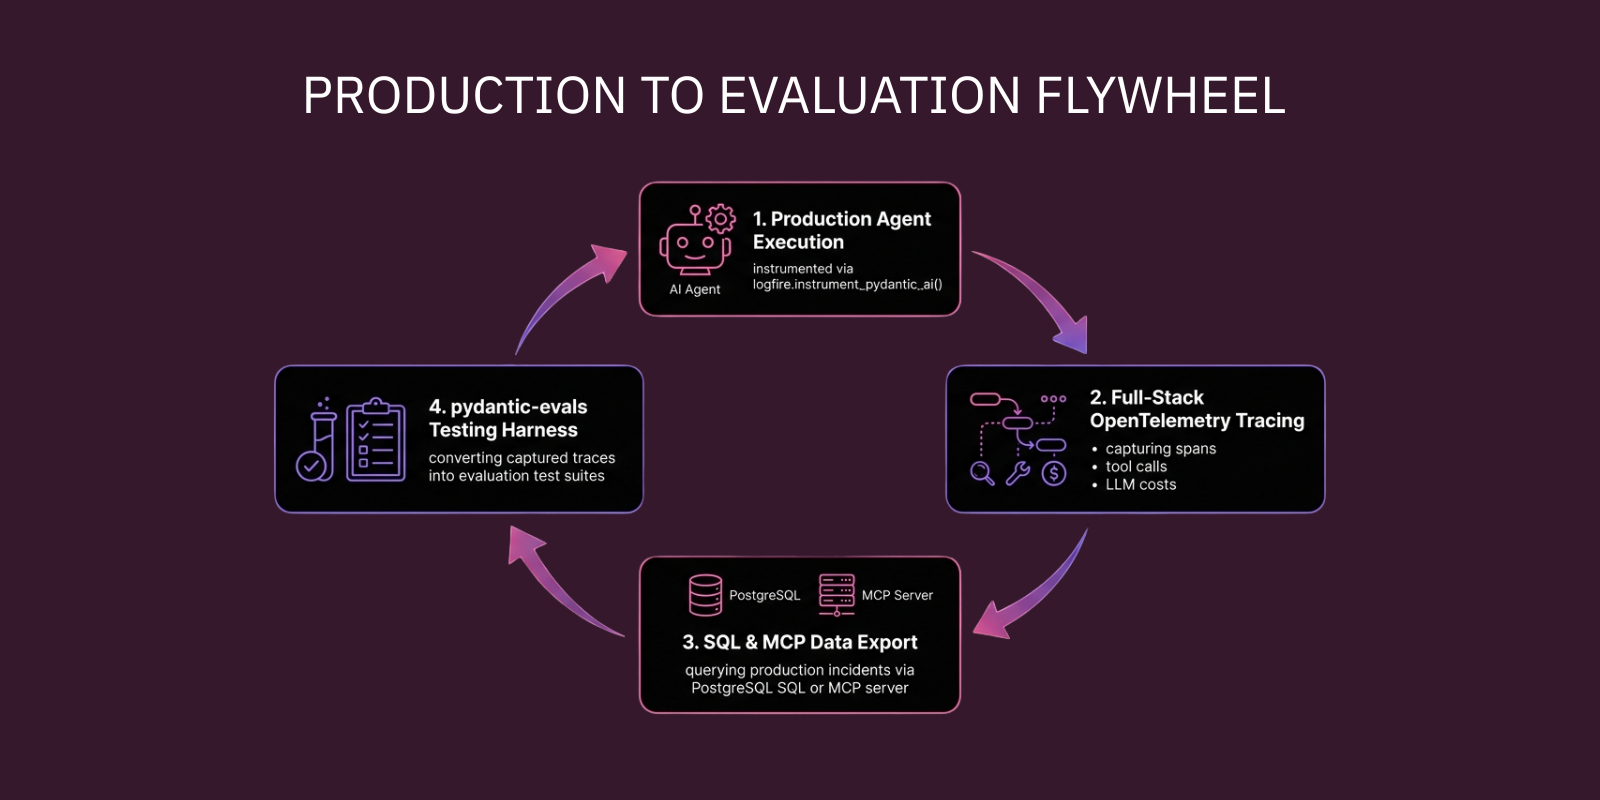
Two more things I've come to rely on. Logfire exposes your observability data over SQL (PostgreSQL-compatible) and ships an MCP server, so a coding agent can query production directly and ask questions nobody built a dashboard for. And it integrates with pydantic-evals, so the traces you capture in production become the datasets you evaluate against. That closes the loop from incident to test.
What changes when observability is a first-class layer
When this layer is in place from day one rather than bolted on after an outage, three things change.
Debugging stops being archaeology. You read a trace and find where the chain diverged, instead of re-running the agent and hoping it misbehaves the same way twice. Cost stops being a surprise, because per-step spend is a number you watch. And production stops being a black box: every captured trace is a candidate test case, so the system gets measurably better instead of anecdotally better. Because this rides on open primitives, anything built on Pydantic AI inherits it. Pydantic Deep Agents, an open-source deep-agent harness (full disclosure, it comes from my team at Vstorm), lights up with the very same one-line setup.
None of this is exotic. It's tracing, metrics, and evals, the same primitives we've always used, applied to a system that happens to think out loud. Agent observability isn't an add-on. It's a prerequisite for running agents in production responsibly. Or, to borrow the house line: AI, it's still just engineering.
Want to see these primitives in a real agent harness?
Pydantic Deep Agents is an open-source, self-hosted agent harness built on Pydantic AI: planning, sandboxed execution, sub-agent teams, and skills, on any model. Instrument it with Logfire and you get the trace view from this article for free.