Today we're shipping Fleet Management in Pydantic Logfire: change what your OpenTelemetry Collectors and application SDKs collect, and where they send it, from Logfire. No config files to edit on each machine. Adjust sampling, redact newly discovered sensitive data, and do it without redeploying the app. Fleet is in Beta and on for every plan.
Why Fleet management?
It's 2am and checkout-api is on fire. Someone shipped it with debug logging on, so every request writes forty log lines. One span attribute carries a card token it shouldn't. The same data goes to Logfire and to the second backend your platform team runs. Turning any of that off means a pull request, a CI run and a deploy. Forty minutes, if CI is kind. Keeping it on means thousands of dollars per hour in additional cost. The card tokens that went out in the meantime are already in two places.
Your Collectors have the same problem, one layer down. Their settings live in a YAML file on every host, and changing one means an Ansible run or a Helm upgrade across all of them.
Open the service's SDK policy in Logfire, set Minimum log level to Warn, add the token's attribute to Attribute redaction, and publish.
Within seconds the running processes stop sending info and debug logs, and the token is removed before the span leaves the process. Nothing restarted. When the incident is over, set the log level back to Application controlled and publish again.
How it works
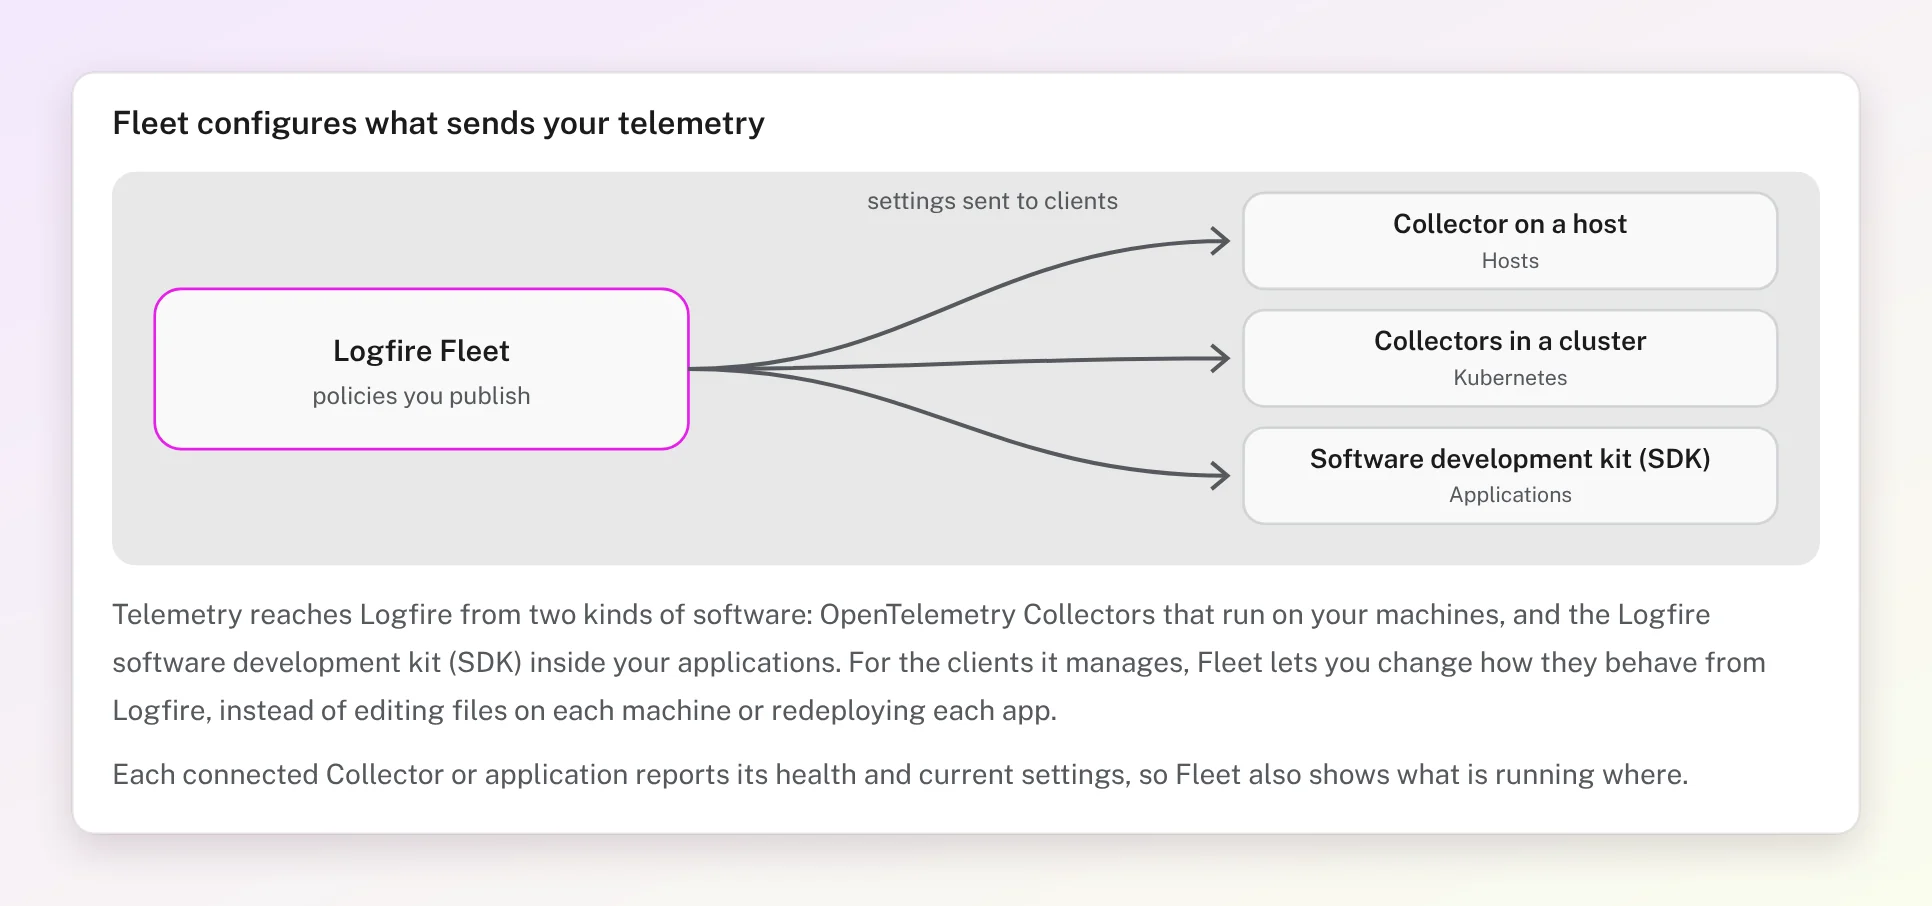
Each Collector and each application takes its settings from a policy: a versioned set of settings you edit and publish in Logfire. Fleet Management is the set of capabilities in Pydantic Logfire for doing this: an OpAMP server built into Logfire that Collectors and SDKs connect to, and the UI where you see them and edit and publish policies. Clients connect to Fleet over OpAMP, the OpenTelemetry standard for managing telemetry software remotely. They report their health and the settings they're running, and connected clients pick up a new version within seconds of you publishing it. With rollouts on, it waits until you start a pilot group.
Fleet carries settings, not telemetry. Your applications keep sending data with the write token they already have, and your Collectors keep sending wherever their pipeline says.
Manage in Logfire, send anywhere
A Collector policy holds the Collector's whole pipeline, exporters included. If it sends to Logfire and to another backend, you manage both from Fleet.
The same goes for applications. In Python, Node.js, Java and .NET, the SDK policy governs every exporter the SDK exports through, not only the one pointed at Logfire: the console exporter, a second OTLP exporter for another vendor, an exporter a plugin added. So redaction, sampling and volume controls hold for every destination, and one sampling decision per span holds across all of them. An exporter the application wires up outside the SDK is outside the policy too.
What you can manage
- Collectors on hosts. One command installs an OpenTelemetry Collector as a service on Linux, macOS or Windows and joins it to your project. Pick a starting point (host monitoring, file logs) and Fleet creates the policy.
- Kubernetes clusters. A small bridge in the cluster drives the OpenTelemetry Operator. Your Collectors stay standard
OpenTelemetryCollectorresources. - Collectors you already run. Add Collector › Existing Collector gives you a connection key and a snippet for the
opampextension in Collector Contrib. A Collector managed by Helm or GitOps then shows in Fleet with its health, components and configuration, marked Report only. Its configuration stays yours. - Applications. Python, Node.js, Java, .NET and Go, on the Logfire SDK or a plain OpenTelemetry SDK. On the Logfire SDK it's one option:
logfire.configure(fleet=True)in Python (Logfire 5.5.0, Python 3.11+) andlogfire.configure({ fleet: true })in Node.js (0.22.0). A policy can set trace sampling, sampling rules, minimum log level, which signals to export, volume controls, attribute redaction and scrubbing. Everything it doesn't set stays the way the application configured it.
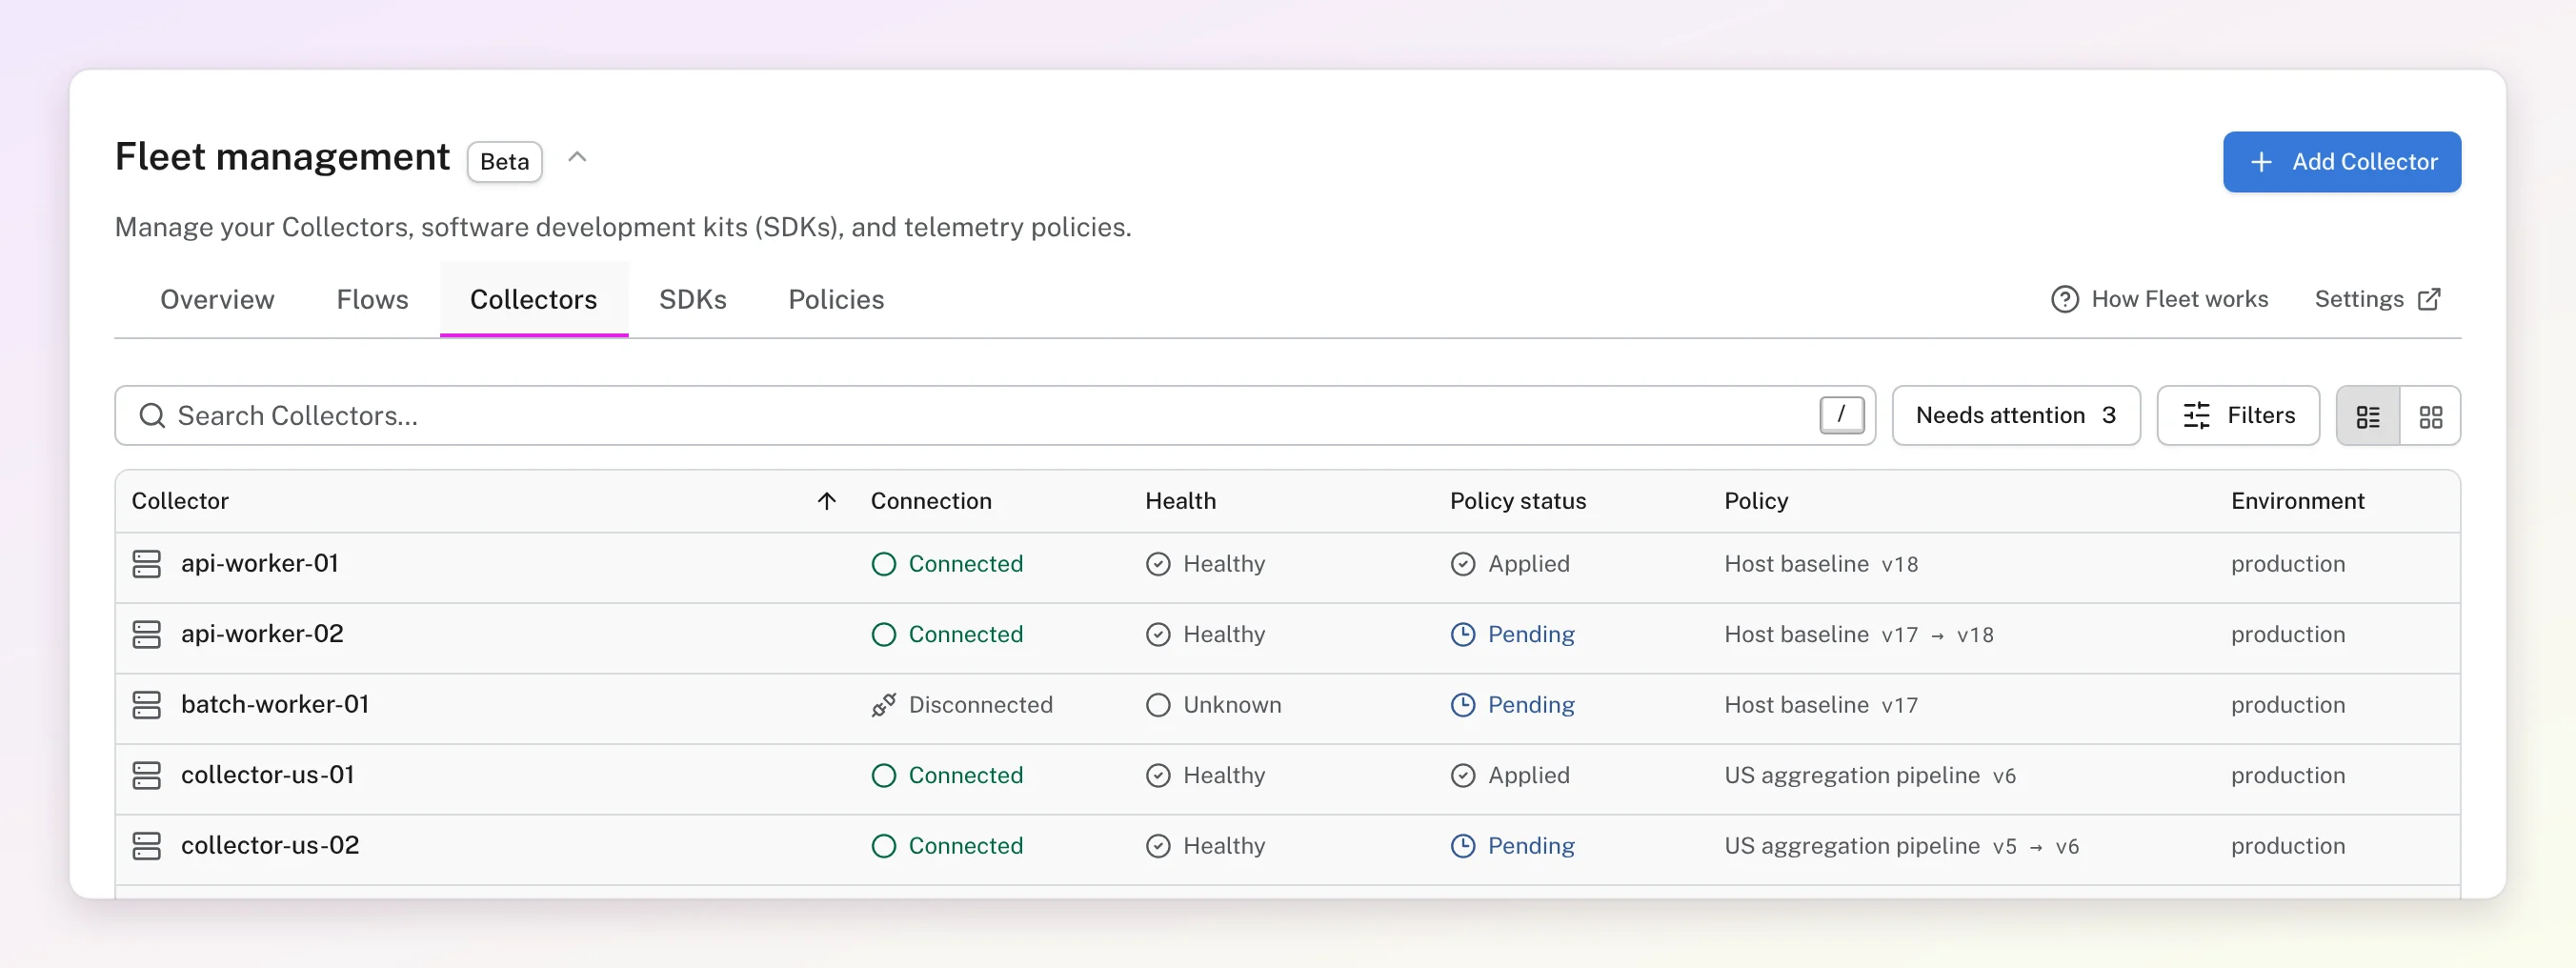
One page shows all of it: every Collector and application, whether it's connected, its health, the policy it runs and whether that policy applied. Flows draws where your Collectors receive data and where they send it, and Overview compares how much each one sent with the period before.
Changing a thousand machines should be boring
A tool that can change every process you run had better make that safe.
- Every policy is versioned. Review shows the change against the published version before you publish, and warns when a Collector lacks a component the new version uses.
- A host Collector or application that can't run a version refuses it and keeps the configuration it has. Fleet shows it as Failed and names the setting or component. Kubernetes Collectors don't check first, so test a change on a pilot group there.
- Roll out to a few first. Turn on rollouts (in early access now) and a new version goes to a pilot group you choose. It doesn't expand on its own: widen it when the results look right.
- Roll back. Open any past version and restore it into the editor.
Built on OpenTelemetry
Fleet speaks OpAMP, manages standard Collectors through the standard Operator, and connects to SDKs through small packages that sit inside the OpenTelemetry SDK you already run. Our OpAMP clients share one protocol core, written in Rust and run in every language, and they run in the same conformance suite as the upstream OpenTelemetry clients. Wednesday's post covers how we built and checked that core.
Getting started
Open Fleet management in your project's sidebar. It's on for every plan.
- Read the docs. Fleet overview, Manage Collectors, Manage applications and Change policies.
- See it working. Tomorrow's post connects an application and a host, then changes both.
- See the product page. Fleet management.
Your plan sets how many applications and Collector policies Fleet manages, and Fleet shows your usage as you go.
Try it on one service this week. If something's missing, tell us on GitHub or through contact.