This post connects a service and the host it runs on to Fleet Management in Pydantic Logfire, then changes the service's log level, redaction and sampling and the host's Collector while both keep running.
You need a Logfire project (Fleet is on for every plan), a write token, Python 3.11 or later, and uv. Every step below also works for Node.js, Java, .NET and Go; the differences are in one table.
Why change it live?
checkout-api logs at debug, puts a card token on one of its spans, and traffic just tripled, taking the ingest bill with it. You want less of all three, and you want it now, not after a deploy.
The service: a FastAPI app with fleet=True
Here's checkout-api, a FastAPI app on the Logfire SDK. The only Fleet-specific part is fleet=True:
import logfire
from fastapi import FastAPI

logfire.configure(service_name='checkout-api', fleet=True)

app = FastAPI()
logfire.instrument_fastapi(app)


@app.post('/checkout/{order_id}')
async def checkout(order_id: str, card_token: str) -> dict[str, str]:
    logfire.debug('cart loaded for {order_id}', order_id=order_id)
    with logfire.span('charge card', order_id=order_id, card_token=card_token):
        logfire.info('charged {order_id}', order_id=order_id)
    return {'status': 'ok'}
fleet=True needs Logfire 5.5.0 or later with the fleet extra. Setting LOGFIRE_FLEET=true does the same without a code change. Without a Fleet endpoint, configure() warns and the app runs unmanaged, so you can deploy the code before the Fleet settings.
uv venv
source .venv/bin/activate
uv pip install --upgrade 'logfire[fleet,fastapi]' fastapi uvicorn
Connect the app to Fleet
In Fleet management, open SDKs and select Add application. Name it checkout-api, choose Python with Logfire, and select Get setup instructions.
Logfire shows a Fleet connection key once. Put it in your secret manager. Then set the variables the setup shows and start the app:
export OTEL_SERVICE_NAME=checkout-api
export OTEL_OPAMP_ENDPOINT=...   # from the setup
export OTEL_OPAMP_HEADERS=...    # Authorization with your connection key
uvicorn app:app
The app logs OpAMP: connected to ...; this SDK is managed as checkout-api when it reaches Fleet. Select Check connection in the setup, and the service shows as connected with its policy applied.
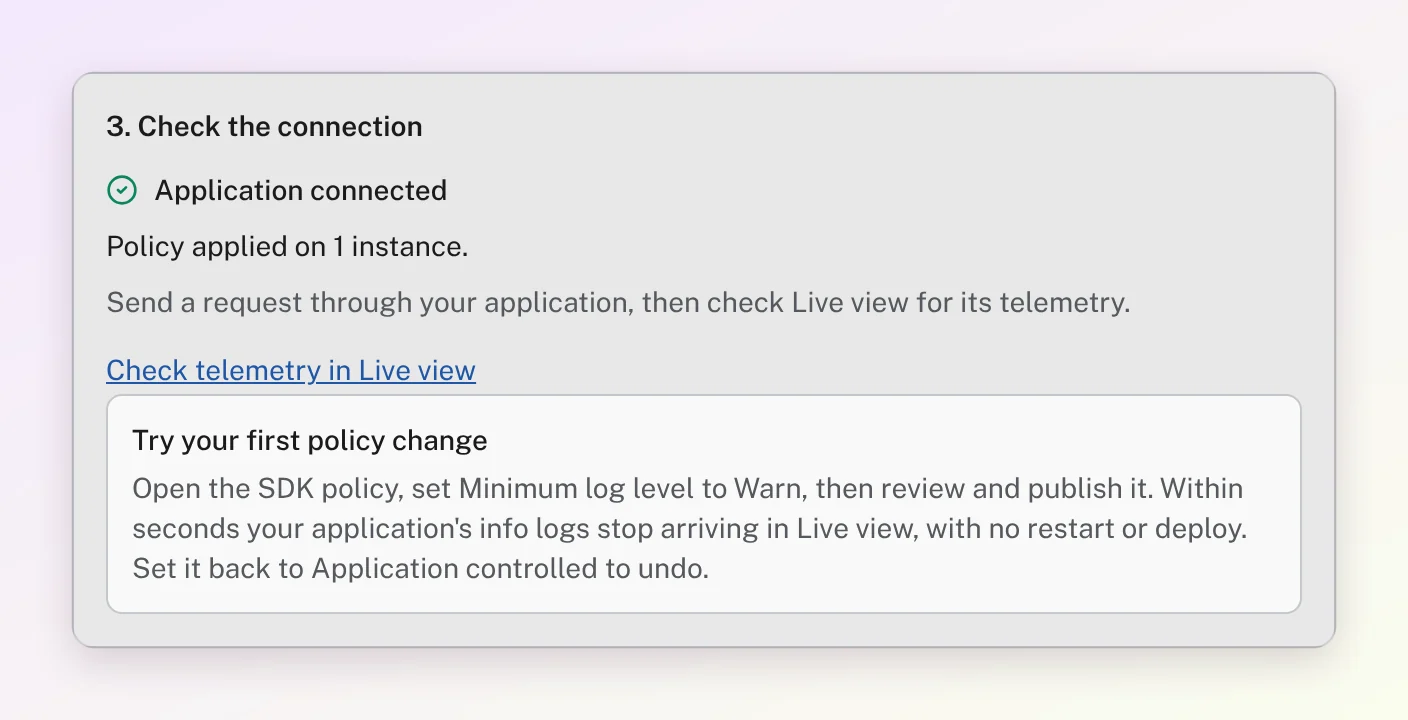
The connection key only manages settings. Your app keeps sending telemetry with its existing write token.
Other languages connect the same way, with one change at start:
- Python, plain OpenTelemetry:
uv pip install logfire-fleet-otel, then run underopentelemetry-instrument. - Node.js 22+, Logfire SDK:
npm install @pydantic/logfire-node @pydantic/logfire-fleet-otel, then passfleet: truetologfire.configure()(0.22.0 or later). - Node.js 22+, plain OpenTelemetry:
npm install @pydantic/logfire-fleet-otel, then start withnode --import @pydantic/logfire-fleet-otel/register app.js. - Java 17+: add the Fleet extension to the OpenTelemetry Java agent with
-Dotel.javaagent.extensions=logfire-fleet-javaagent-extension.jar. - .NET 8+: add the
Logfire.Fleet.AutoInstrumentationplugin to OpenTelemetry automatic instrumentation. - Go 1.25+: call
opampotel.Setup(ctx)inmain, in place of your SDK setup.
The applications guide has the full commands for each.
Change 1: stop the debug flood
Open checkout-api's SDK policy from the SDKs tab. Each section says Set by policy or Application controlled. Everything starts as Application controlled: a policy only changes what you tell it to.
Under Volume controls, set Minimum log level to Warn. Select Review policy, check the change, and publish.
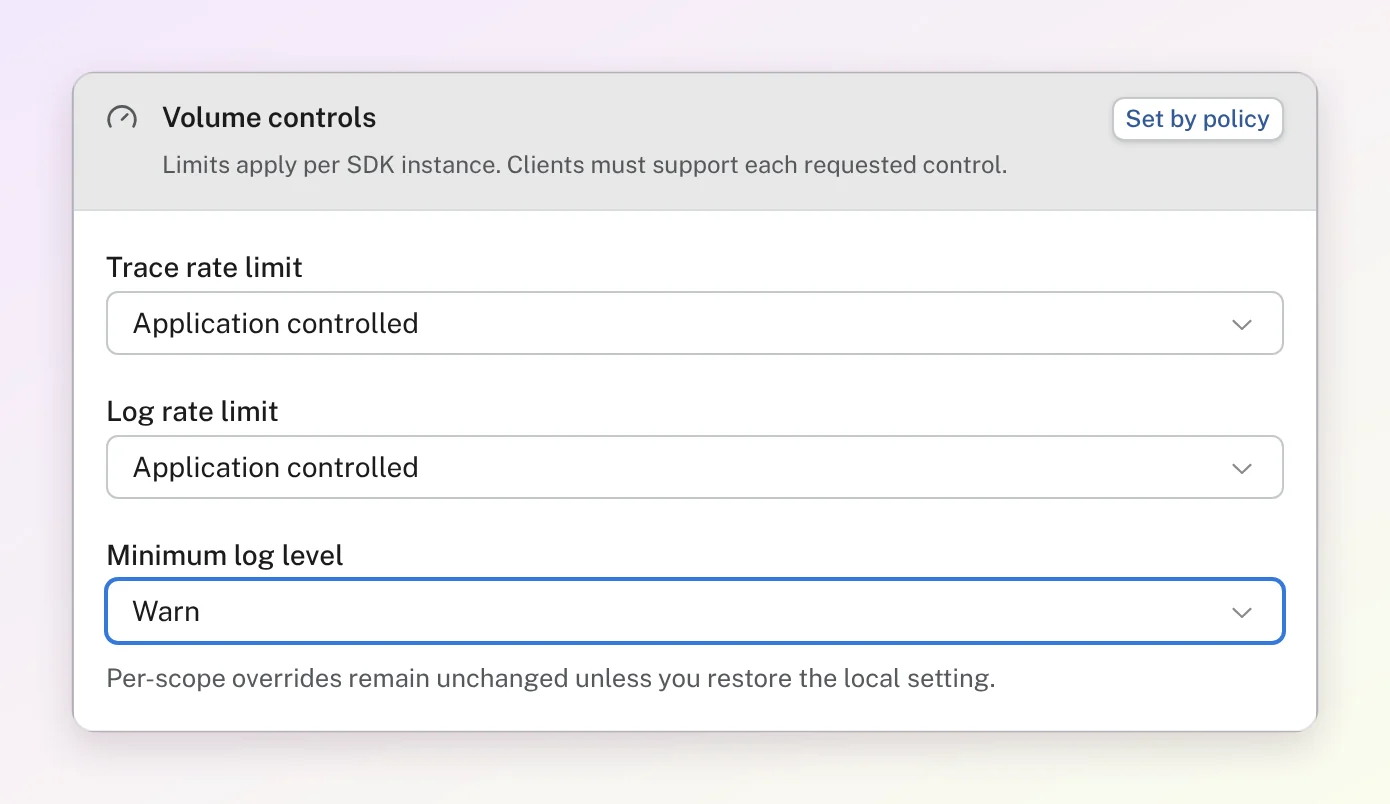
Within seconds the debug and info logs stop arriving in the Live view. The process didn't restart. Its own log level didn't change either: Fleet drops the records at export, so a later policy can bring them back.
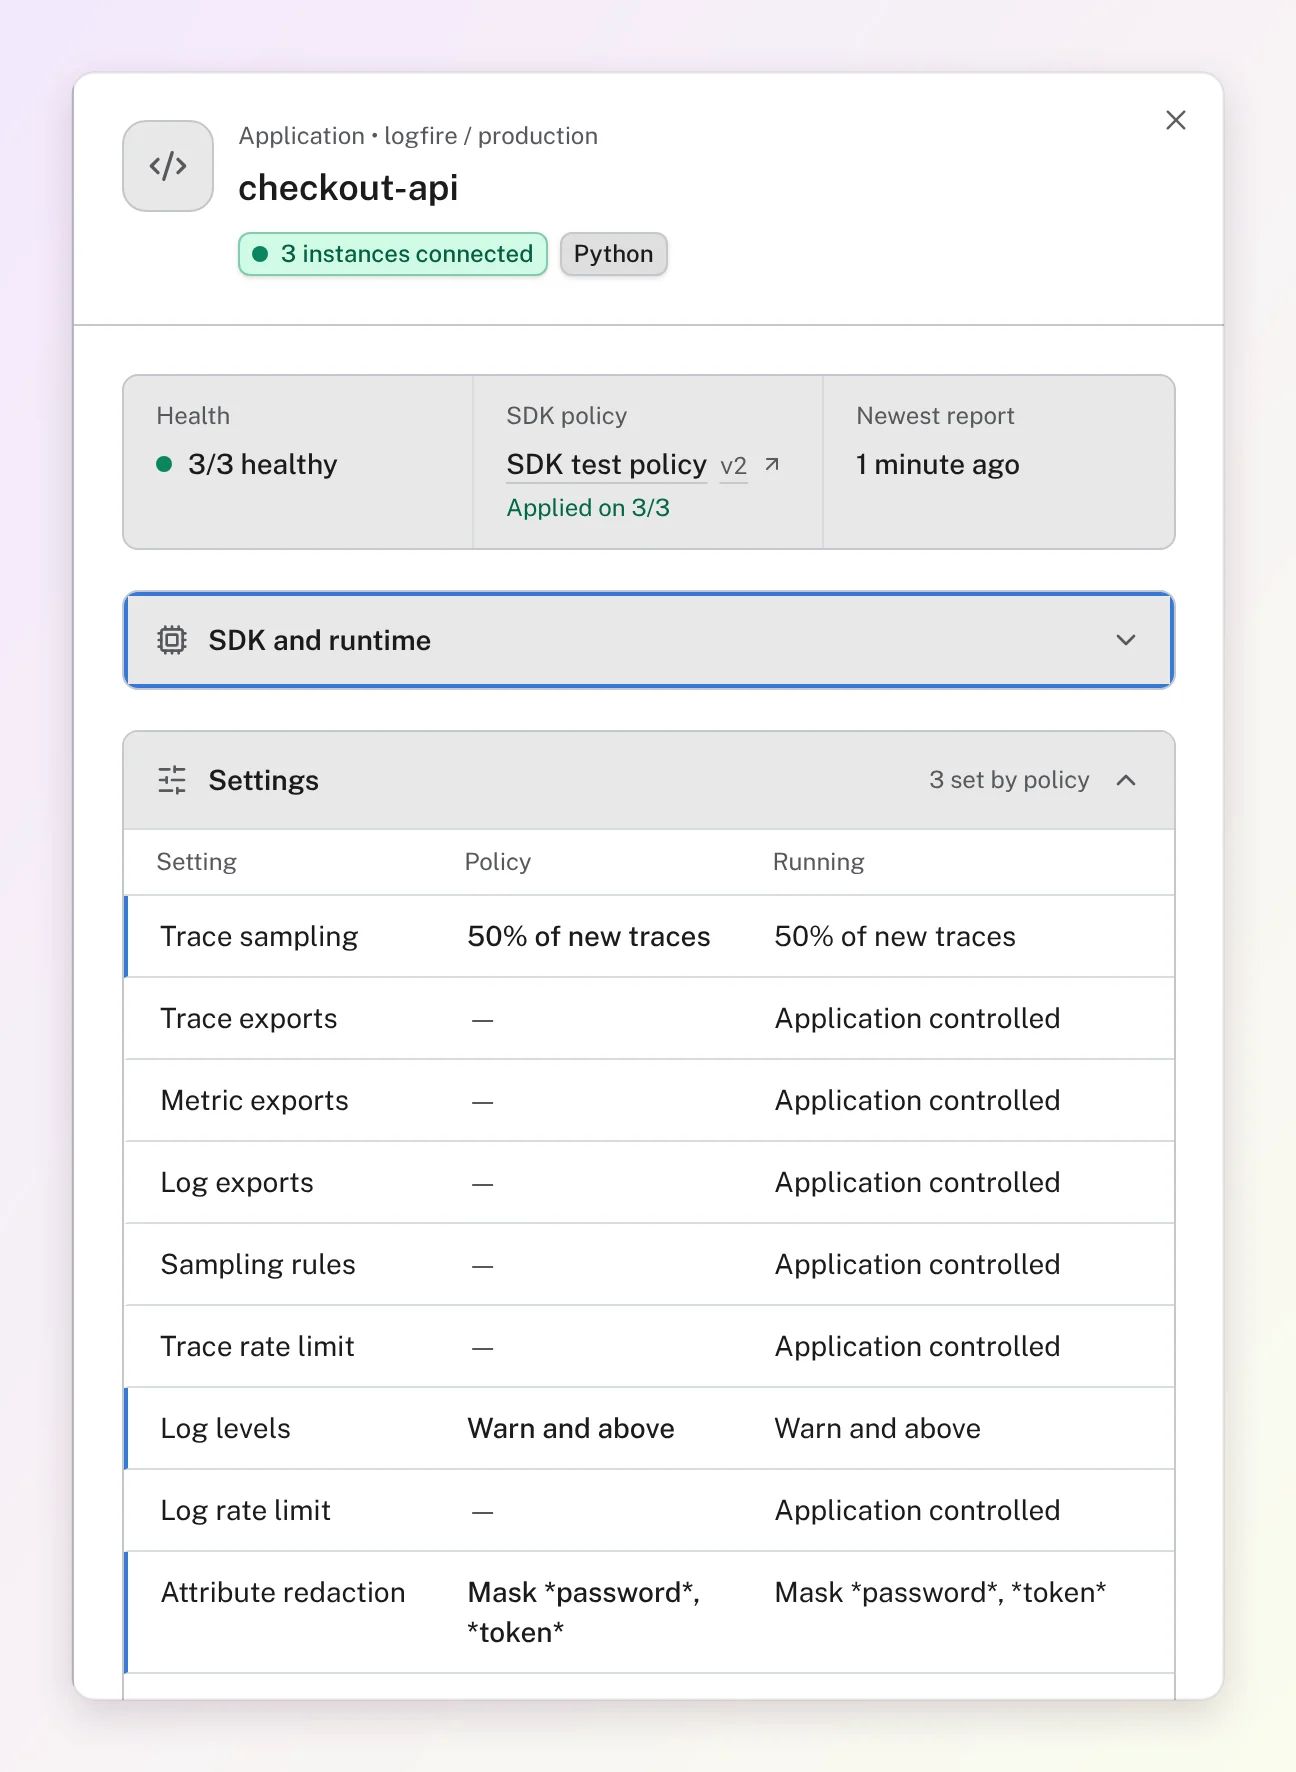
The application's page in Fleet lists each setting with what the policy asks for and what the instances are running.
Change 2: redact the token
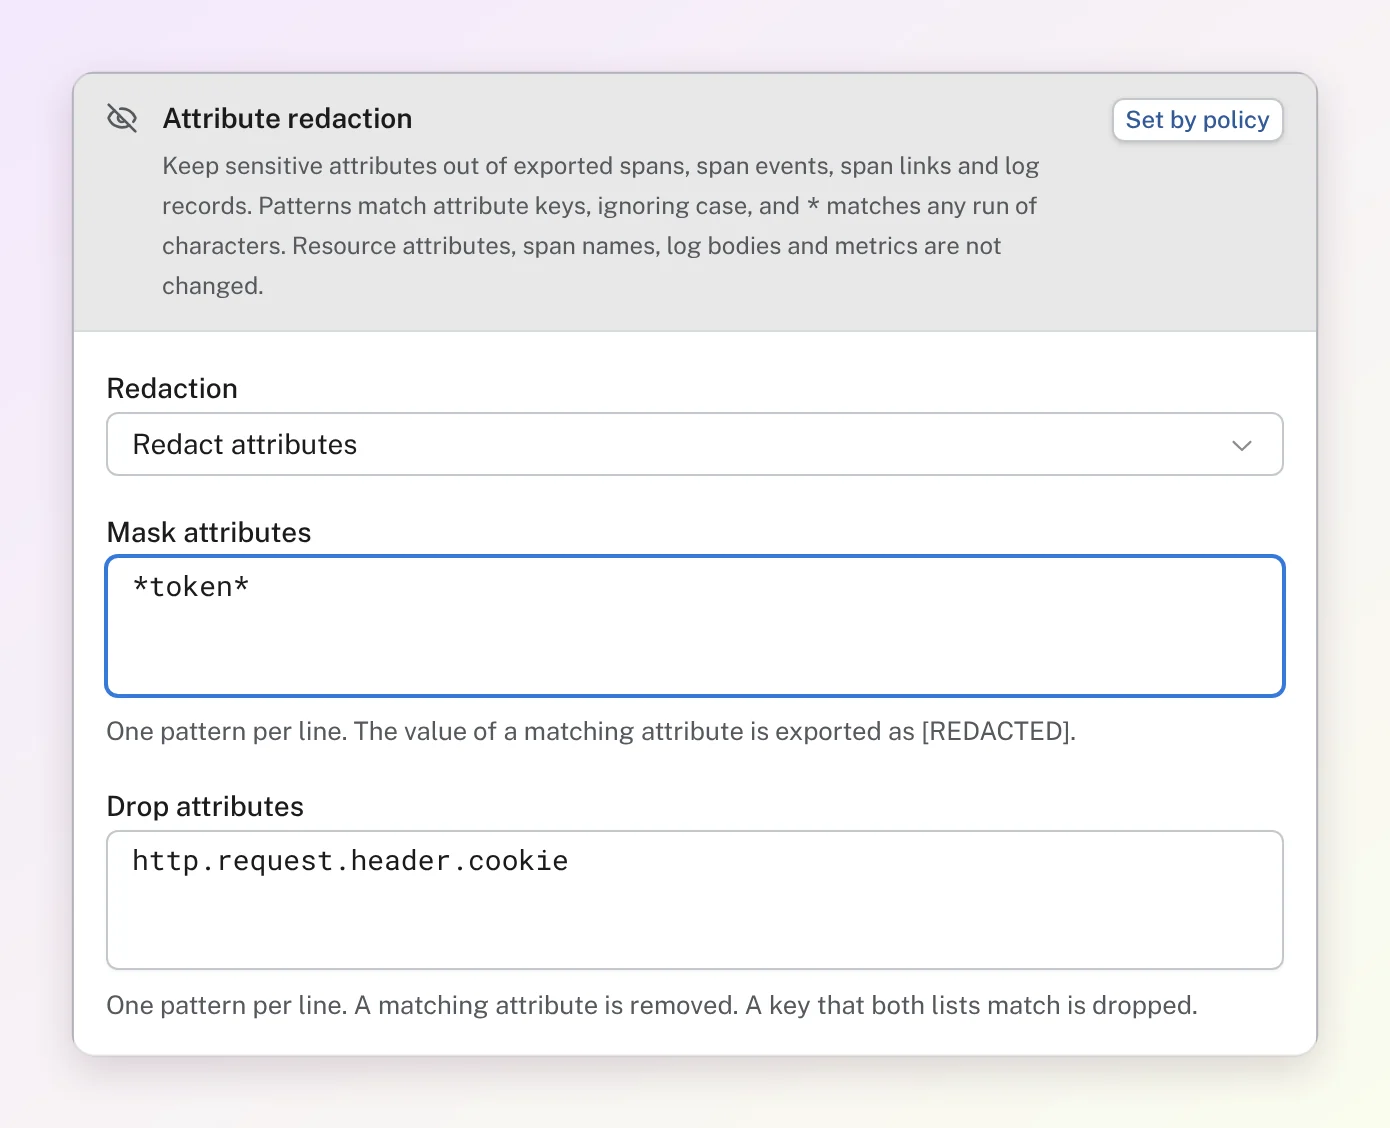
Under Attribute redaction, add *token* to the attributes to mask, and publish. The SDK replaces each matching attribute's value with [REDACTED] before the span is exported, so it never reaches Logfire or any other backend the SDK sends to. Scrubbing goes further and matches values as well as keys, using the same patterns the Logfire SDK scrubs by default.
Change 3: sample a tenth of the traffic
Under Trace sampling, set the rate to 10%. Under Sampling rules, add a rule that drops /health* entirely; the first rule a new trace's root span matches decides its rate, before the overall rate applies. A span whose parent was sampled is still sampled, so traces stay whole.
Publish. Traces you don't sample never reach Logfire, so the review step is worth reading.
Try it on two instances first
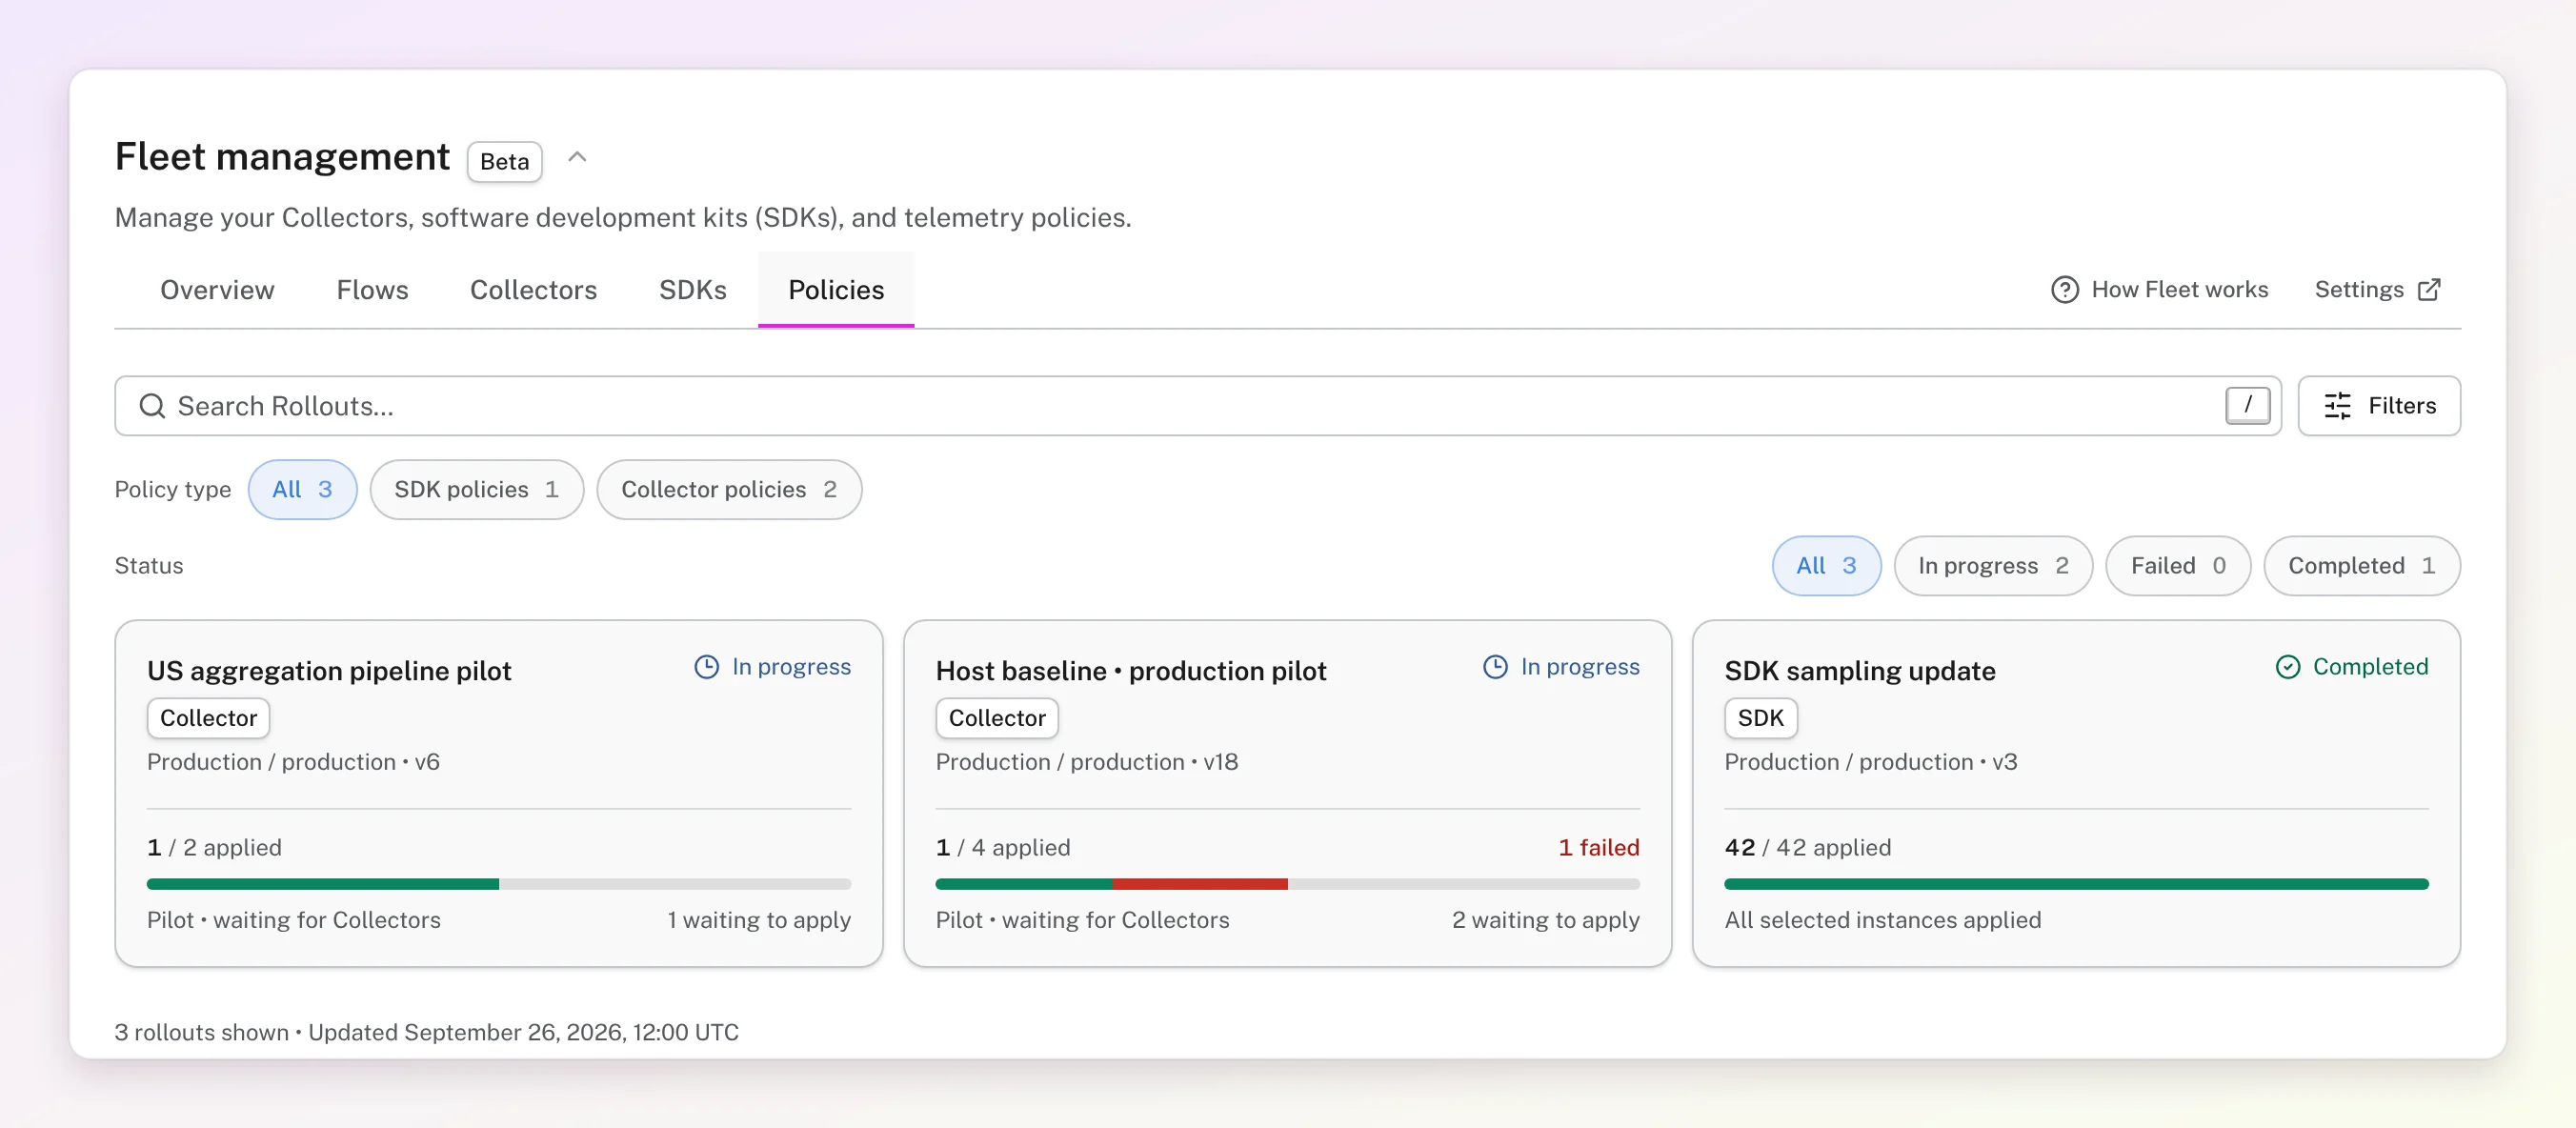
That last change is the kind you'd rather try small. Rollouts are in early access now. Where you have them, select Settings in Fleet management and turn on Use rollouts. Now publishing a version sends it to nobody until you start a rollout:
- Publish the policy, then select Roll out policy.
- Choose how many instances join the pilot, say two, and start it.
- Watch Policies › Rollouts: it counts the instances that applied the version and any that failed.
A pilot doesn't grow on its own. When the two instances look right, start another rollout with more. If they don't, open the previous version from the policy's history, select Restore into editor, and publish it.
Add the host's Collector
checkout-api runs on a Linux VM, and you want that VM's metrics and its nginx logs too. In Collectors, select Add Collector, then Host. Under What to collect, pick host monitoring, then Get install command.
Copy the enrollment key (Logfire shows it once) and run the command on the host. For a project in the US region:
uvx --from 'logfire-cli>=0.1.19' logfire-cli --beta --region us --org <your-org> collector install \
  --project <your-project> --token-stdin --yes
--token-stdin asks for the key without echoing it, so it stays out of your shell history. The installer asks for administrator access and sets up an OpenTelemetry Collector as a service. The host doesn't sign in to Logfire: the key places it in your project. The setup shows when its first data arrives. The host's metrics then show in the Hosts view, which The OOM that was not your agent introduces.
To add the nginx logs, open the host's Collector policy, add /var/log/nginx/*.log to the file logs, and select Review version. If a Collector on the policy lacks a component the new version uses, the review says which. Publish, and the Collector picks it up. A Collector that can't run a version refuses it and keeps its current configuration, and Fleet shows Failed with the reason.
Kubernetes, and the Collectors you already run
For a cluster, Add Collector › Kubernetes installs one small bridge that drives the OpenTelemetry Operator. Fleet's policy describes the cluster's Collectors, and the bridge creates, updates and deletes the OpenTelemetryCollector resources to match. The setup walks you through four steps, from checking your kubectl context to kubectl apply -f fleet-bridge.yaml.
If Helm or GitOps already manages your Collectors, or you set one up by hand as in Observability with Logfire and OpenTelemetry Collector, keep it that way. Select Add Collector › Existing Collector to get a connection key and a snippet for the opamp extension in Collector Contrib. Each Collector then shows in Fleet with its health, components and the configuration it runs, marked Report only. Fleet doesn't change that configuration. See Connect an existing Collector.
See what a policy changed
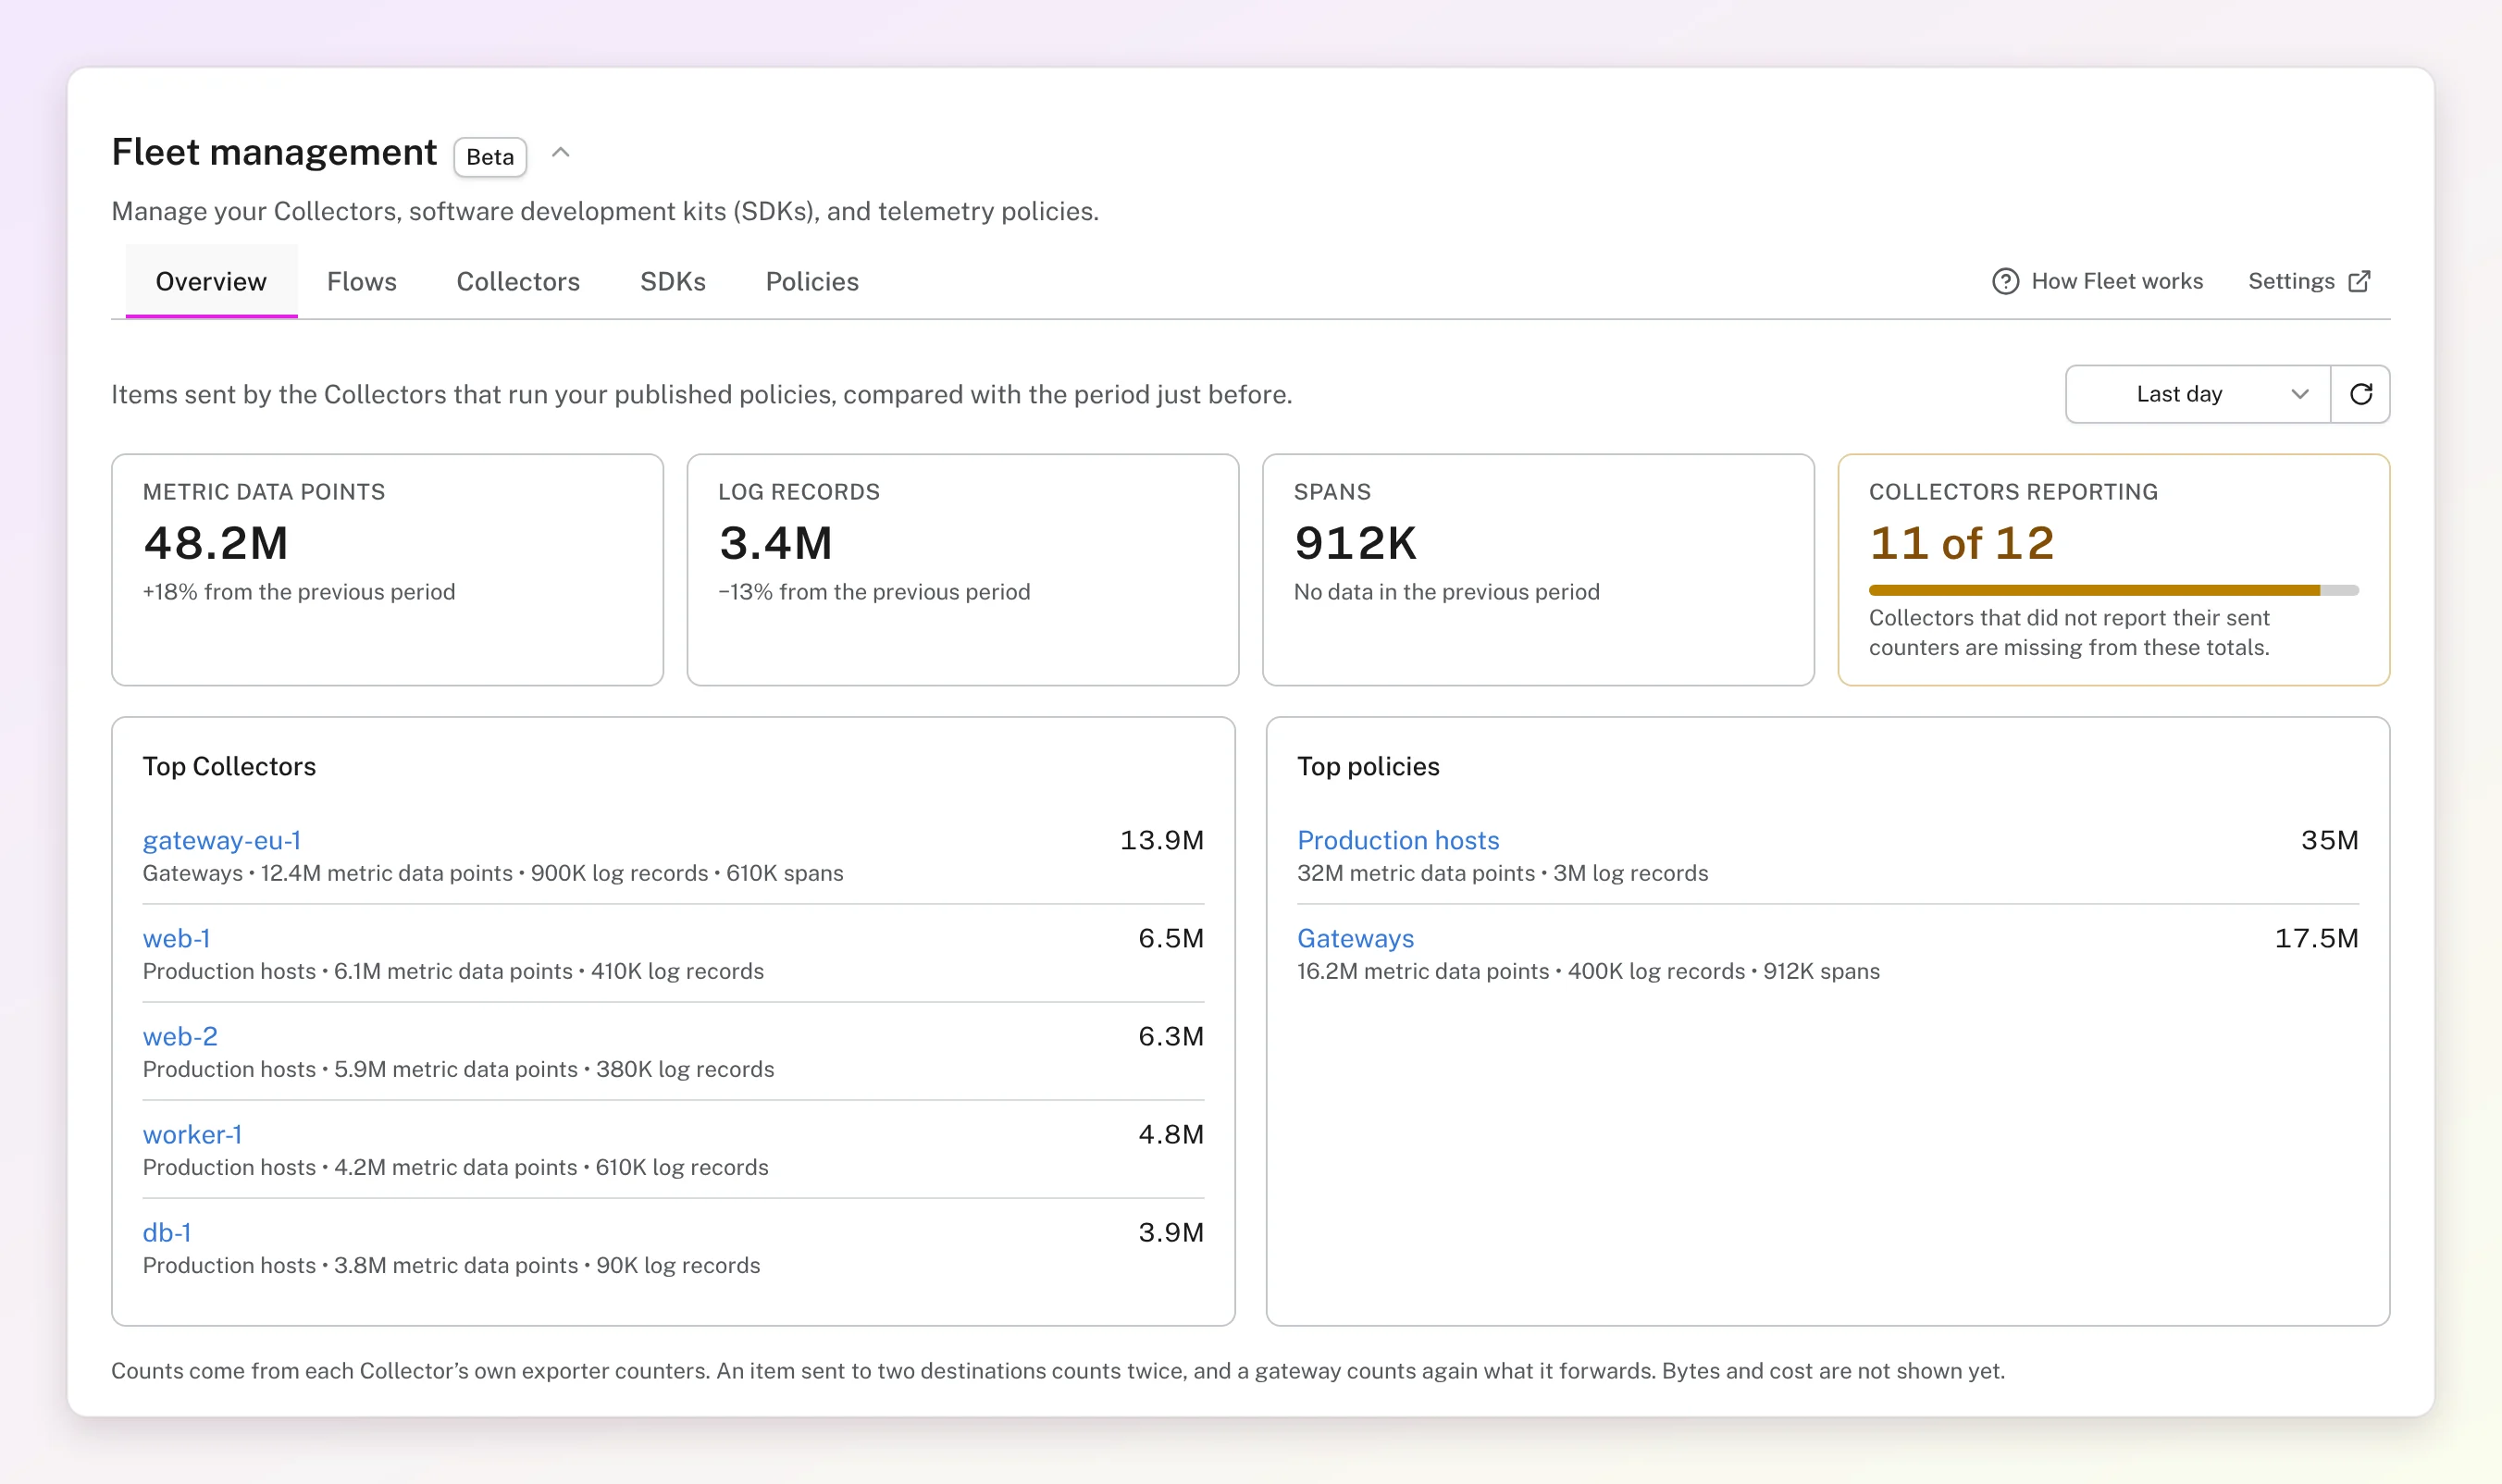
Overview compares how much your Collectors sent with the period before, by Collector and by policy, so you can see what a Collector policy change did to volume. Flows draws where each Collector receives data and where it sends it.
When it doesn't connect
| What you see | What to check |
|---|---|
| The app never connects | The Fleet package loads before your app starts, and OTEL_OPAMP_ENDPOINT and OTEL_OPAMP_HEADERS are set. The app's logs name connection and authentication errors. |
| Policy status shows Failed | Open the app or Collector in Fleet. It names the setting or component it couldn't apply. |
| No telemetry arrives | Fleet doesn't carry telemetry. Check the write token and region. |
Getting started
- Manage applications, with the commands for every language.
- Manage Collectors, for hosts and Kubernetes.
- Change policies, for rollouts and version history.
- The language guides in pydantic/opamp-clients, with framework and deployment examples.
Tomorrow: how we check the OpAMP clients behind Fleet, ours and upstream.