Ever since Claude Code was first released, we've experienced a continuous barrage of new models, capabilities, and harnesses to make LLMs the primary means of developing software. These advancements have greatly increased the scope of the applications of these tools, to the point where most teams are using them daily.
The massive improvements in harnesses have not removed one of the greatest challenges: the process remains opaque. When the agent fails or spins its wheels in endless exploration, it's not clear from the outside what is going on. To fully utilize your own harness, you need to know what it's doing and how to leverage that information.
In my day to day I work with teams that are interested in improving their coding harnesses but skeptical about the importance of tracing every interaction. I see harness improvement and tracing as intrinsically linked. From the outside it may look like simple telemetry data, but it carries rich signals that are necessary for a number of monitoring, evaluation, and improvement flows.
This article will walk through some of the most powerful use cases for coding harness tracing, and show how to close the loop by making traces available to the coding harness for optimizations across models, users, teams, and companies.
Why coding harnesses need observability
Coding harnesses work well in a wide range of scenarios. The gaps only become clear as you build intuition. The longer you work with these tools, the more often you end up asking questions like these:
- Where is my time and token budget actually going?
- How do I pick up useful context from an old session?
- Why is my agent getting lost during a task?
- Which harness and model should I use for this task?
- How do I close the loop so the agent can sort this out on its own?
These questions will be our focus going forward. We will discuss how to approach each of these systematically in depth. Ultimately though, the answers require observability. The stuff harnesses do make available, the inputs/outputs of a session log, isn't all that useful for the purposes of analysis and improvement.
The harness hides the process
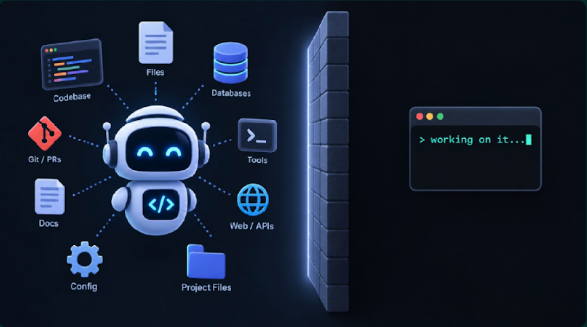
The agent reads files, queries databases, runs tools, calls web APIs and edits code, while from outside the harness all you see is a terminal reading "working on it...".
To get a real signal, you need an observability solution that works across providers and records the entire path from request to response, most of which is hidden inside the harness. Model invocations, tool calls, retries and dead ends happen out of view, and none of it is surfaced and persisted for long-term reflection. Before you can answer any of these questions, you need a record of everything the agent did.
What a trace gives you
Logfire's coding agent tracing can capture the model invocations, tool call execution, and request/response pairings across a session for a variety of harnesses, depending on the capture policy you configure. Within each captured step it records metadata such as duration and usage when the harness and provider supply it, and cache reads and writes may also be available. For supported providers, Logfire estimates cost from the recorded tokens and pricing data, so you can see an estimated API cost for the supported, instrumented calls in a session.
That answers the first question, and the rest follow from the same data. The order of operations shows where an agent went off course. Each trace records which harness and model ran it, so you can compare runs. Sessions are stored and searchable with SQL, so old work stays within reach. And through the Logfire MCP server, an agent can run SQL queries and leverage the context from past operations, which is ultimately how you close the loop.
Closing the loop
Closing the loop means making the rich historical session context fully available within every coding harness you spin up. In the following sections we'll address each of the earlier questions using this pattern. We'll see how the Logfire MCP server can be used to run SQL operations on tracing data from within your harness to monitor, automate, and improve workflows.
These examples are not comprehensive, but they represent the use cases I've seen having the most impact for teams.
Metrics for the work you care about
Coding harness traces carry more than just latency and token counts. They record rich information about what the team is working on, the patterns they're using, and where the inefficiencies are. Different organizations, teams, and users will care about these for different reasons. With the Logfire MCP server, anyone can easily develop metrics and dashboards for the things they want to track.
The same pattern holds regardless of the metric. From your preferred harness, just ask the agent to use Logfire MCP to create the dashboards and views you want to see. Because most components in Logfire are defined as SQL queries on traces, agents can help build and revise views.
The process is outlined below and was used in all the subsequent examples.
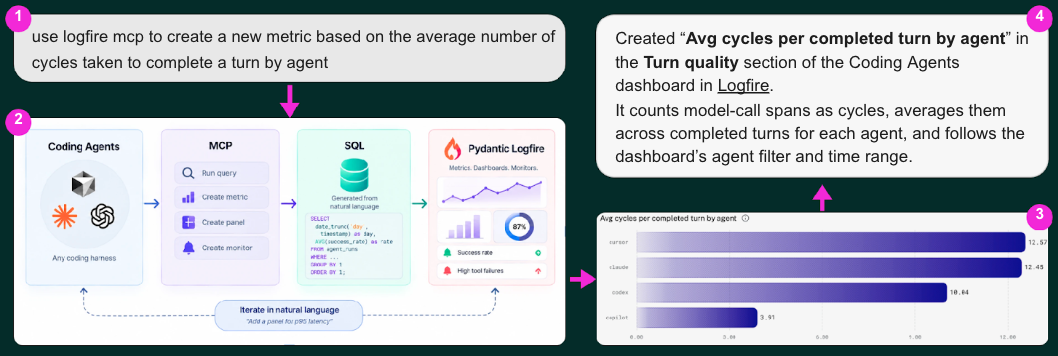
The process used for the examples that follow: a plain-language request to the coding agent goes through the Logfire MCP server, which runs SQL over the trace data, creates the panel (here, average cycles per completed turn by agent) and replies with a link to it.
In this example the agent took a request for "average cycles taken to complete a turn by agent", queried the data, found the relevant field, made the new panel, generated the query to represent average operations per turn grouped by harness, and responded once completed with a link to the panel.
Tracking coding productivity
Because the queries can access any facet of the trace, and the traces represent coding work, you can develop panels to track specific operations related to productivity, like commits and pull requests. The chart below shows commits over time with the number of lines added and deleted. This can be useful to immediately see if the agent has made large deletions or if the size of individual commit operations is unexpectedly small or large.
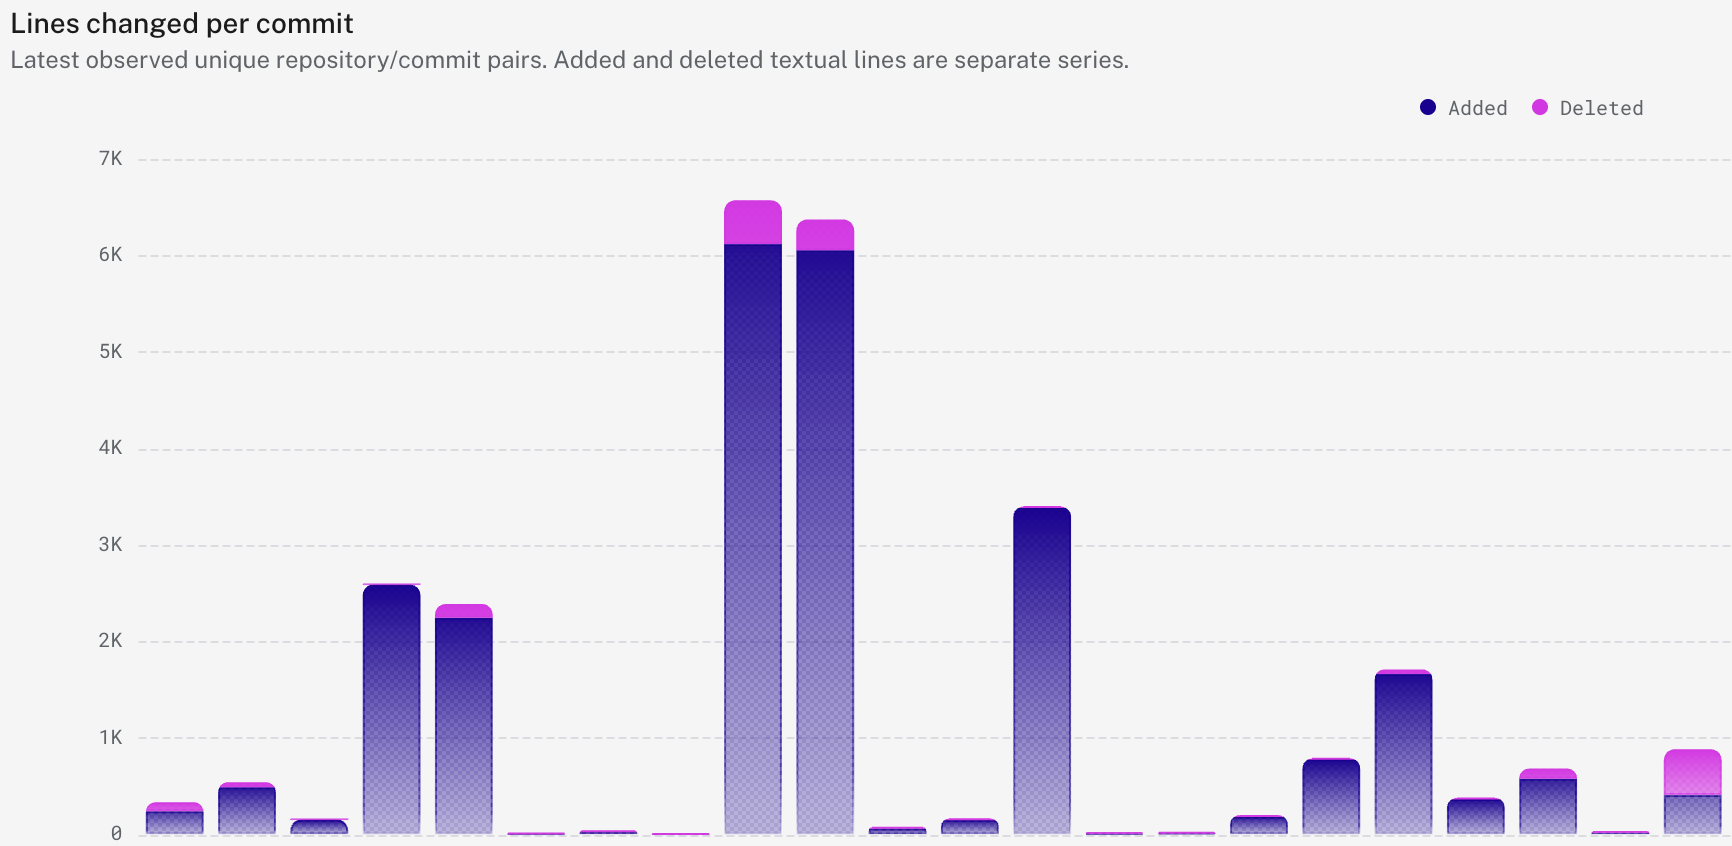
Lines added and deleted per commit, taken from agent traces.
The following chart shows the time taken from first commit to PR creation, and from first edit to commit. Views like these are possible because the coding agents run git operations with bash tools that have a structure that can be reliably broken down with a SQL query. The traces contain the timing and associations between coding operations and eventual CI/CD, so we can track the amount of time that goes into commits and PRs directly from traces.
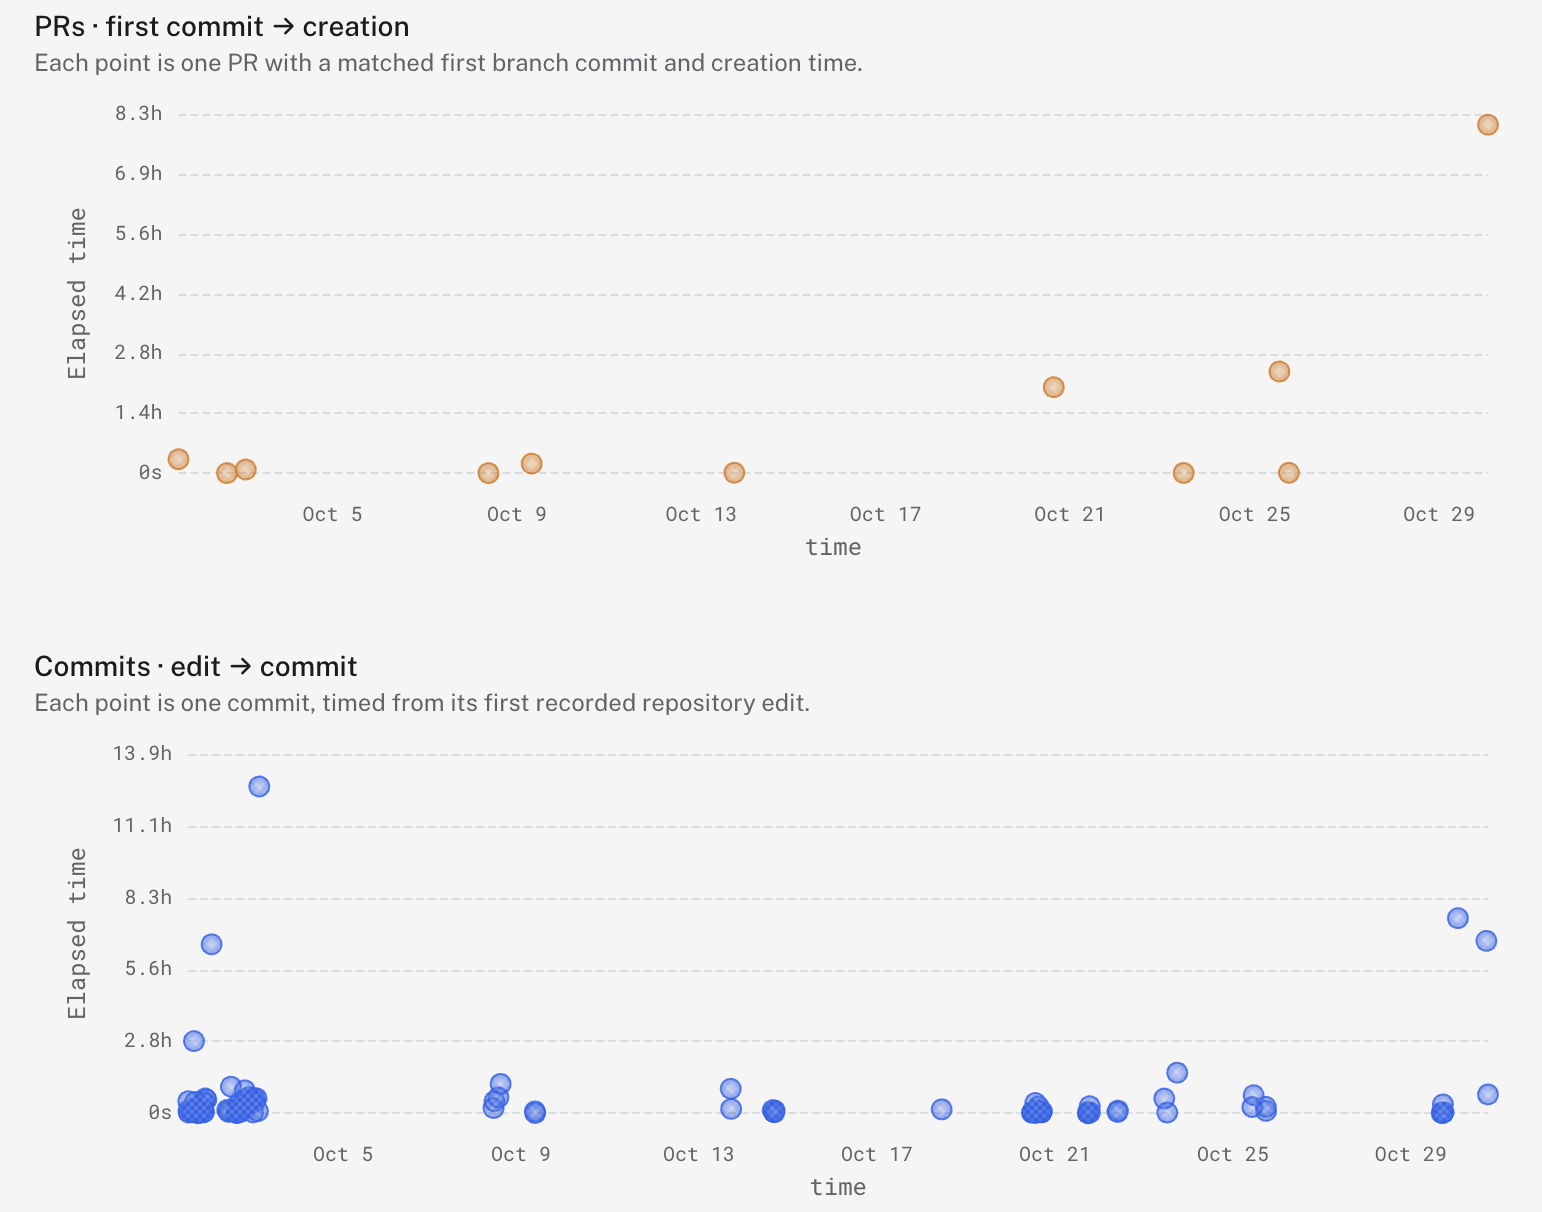
Time from first commit to PR creation (top) and from first recorded edit to commit (bottom) across October, one point per PR or commit.
Tracking cost and time
If you need to understand where your tokens and time are going, charts that cover spending over time and durations of operations are a good starting point. The visualization below shows the token cost incurred over 2 months for 4 different agent harnesses. From this kind of visual, you can begin to assess inefficiencies and opportunities for improvement flows.
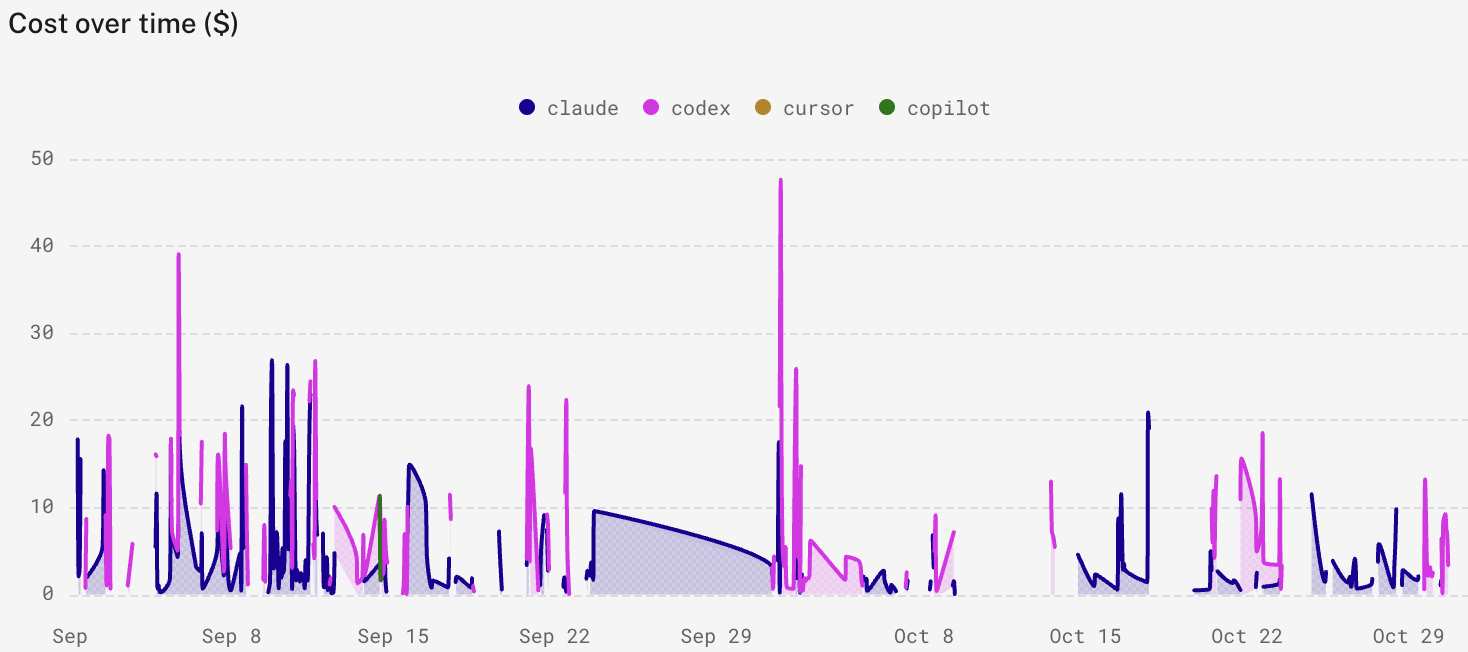
Daily token cost in dollars from September through October for four harnesses: Claude Code, Codex, Cursor and Copilot.
For general comparisons between harnesses and models, you can break down aspects of performance to get a sense of the efficiency of different configurations. The charts below show comparisons between harnesses and models on the average number of tool calls per turn and the average number of tokens per call. Monitoring these characteristics can provide early signals that one setup is more efficient than another and prompt focused experimentation flows that we'll discuss later.
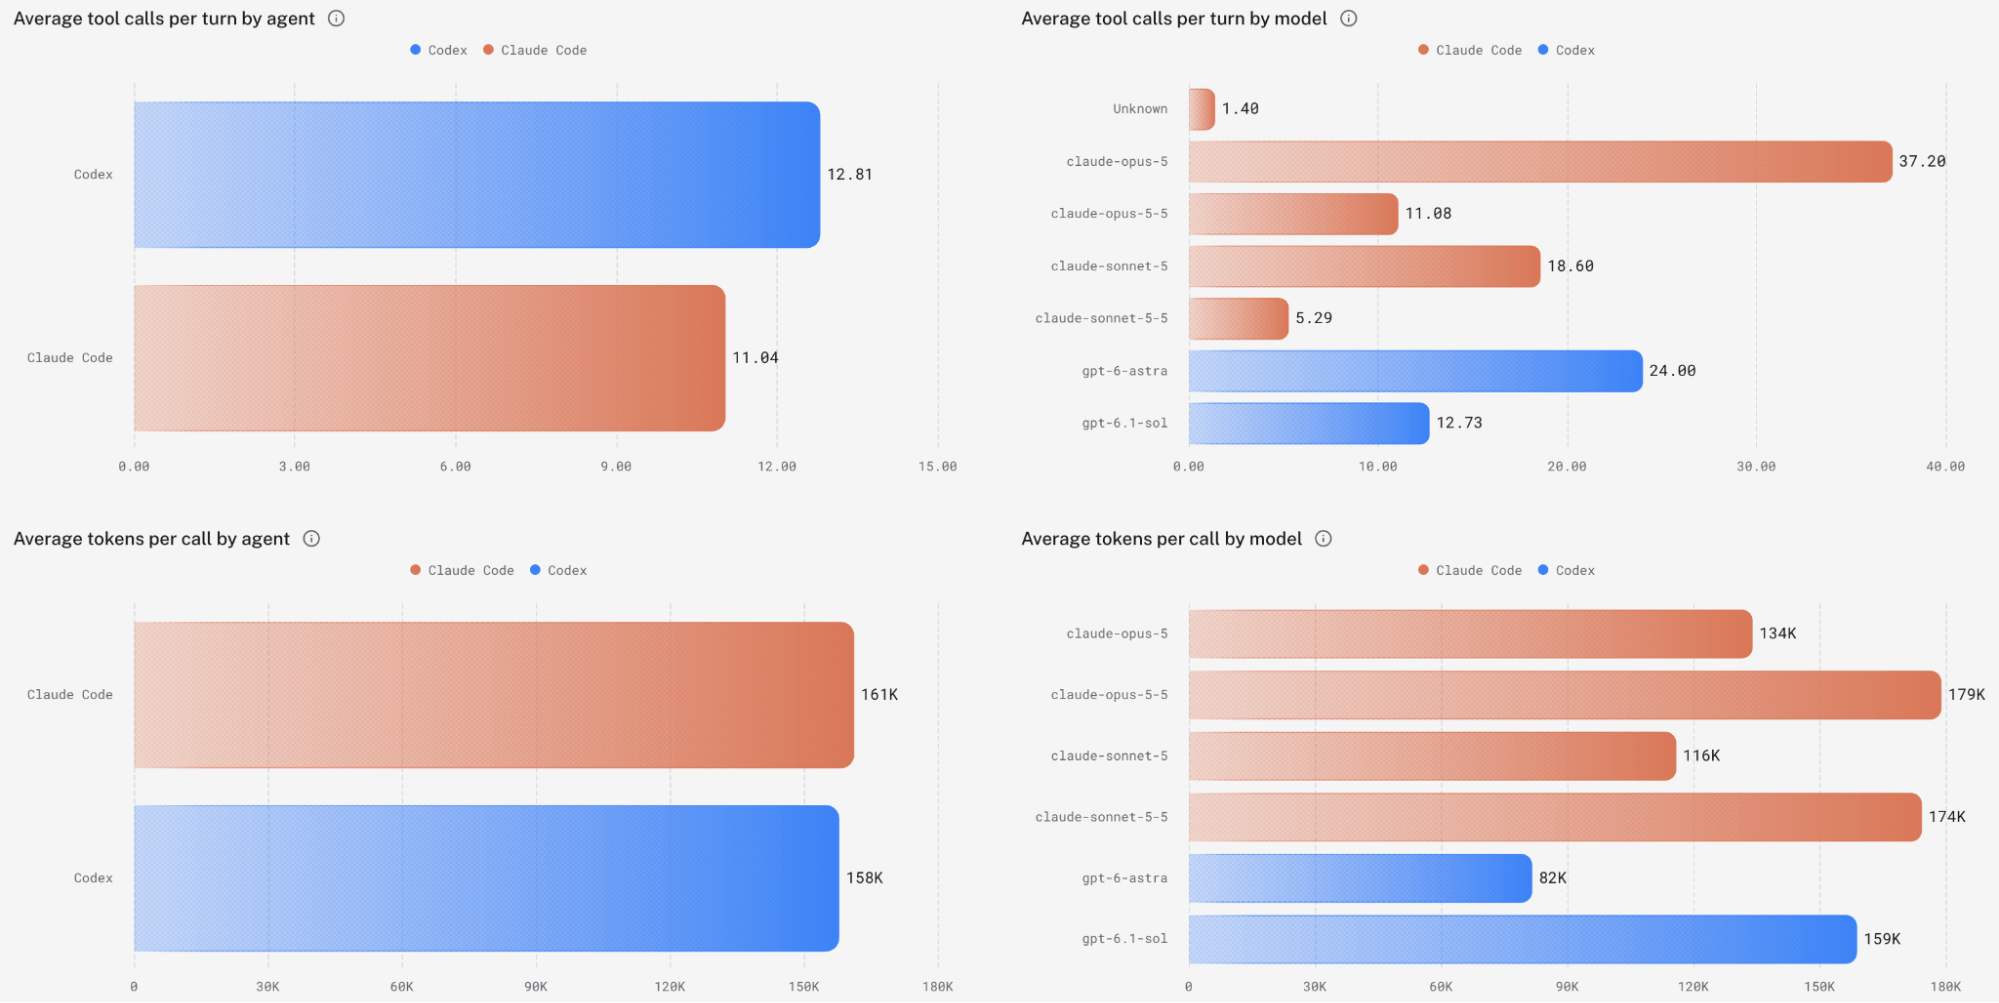
Average tool calls per turn (top) and average tokens per call (bottom), grouped by harness (left) and by model (right).
Monitoring a software factory
Software factories use a collection of collaborating agents to take code through the development pipeline. Recently I've been working to improve the configuration of my software factory and added harness telemetry to capture the sessions. I was particularly interested in how long the tasks were taking to get through the pipeline, and how many tokens were being used. The chart below exposed the problem.
While the implementation and test phases were generally cheaper than the review stages, the pipeline was getting stuck in expensive cycles of reviews and fixes, leading to high token use and cost at the review and review-fix stages. We'll revisit how to address this problem later when looking at evaluation and experimentation on different reviewer configurations.
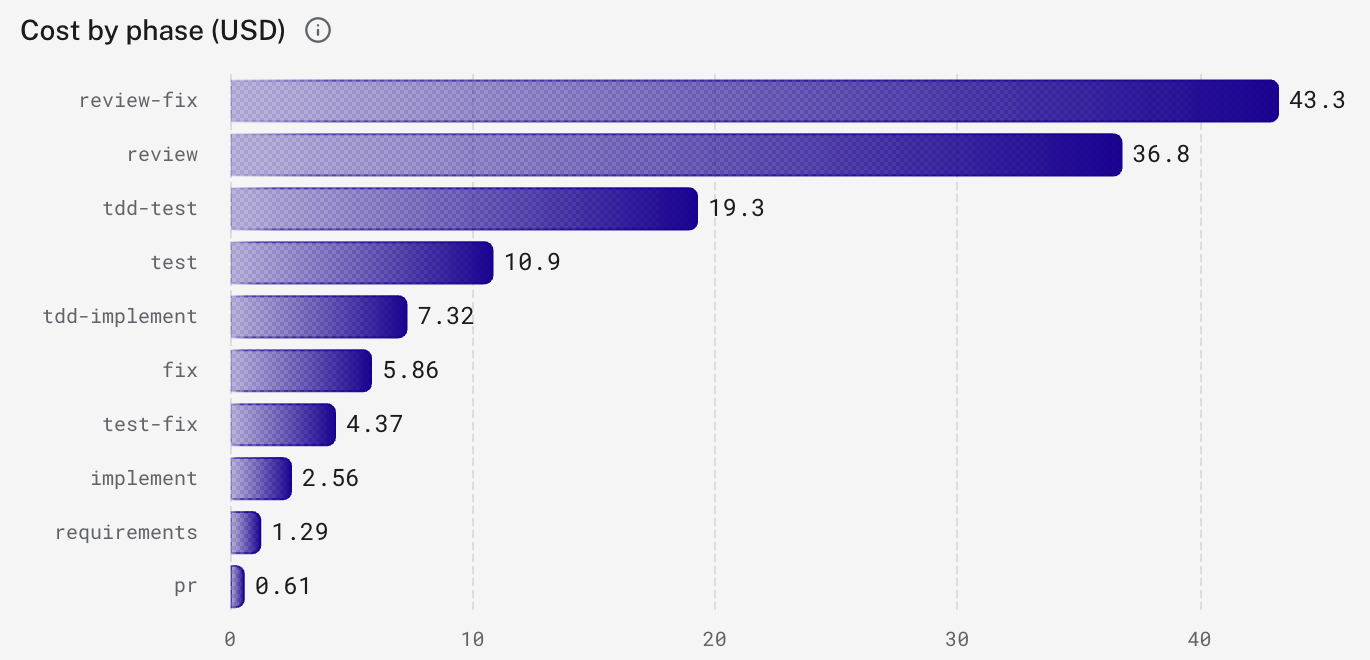
Cost by phase of the software factory pipeline, in US dollars. The review-fix ($43.30) and review ($36.80) phases together account for about 60% of the roughly $132 total.
Making use of past work
Closing a session usually means abandoning the context. You generally have 3 options if you ever need to reference prior work again:
- Open the same session with the full context eating up tokens
- Start from scratch
- Set up some file system pattern that the agent must manage
With coding harness tracing and Logfire MCP, you can retrieve prior workstreams in a new session, do it across harnesses, and extract only the relevant context without bloating your session.
That pattern opens up a lot of possibilities beyond just picking up prior work. The graphic here shows three of the patterns that coding harness tracing facilitates.
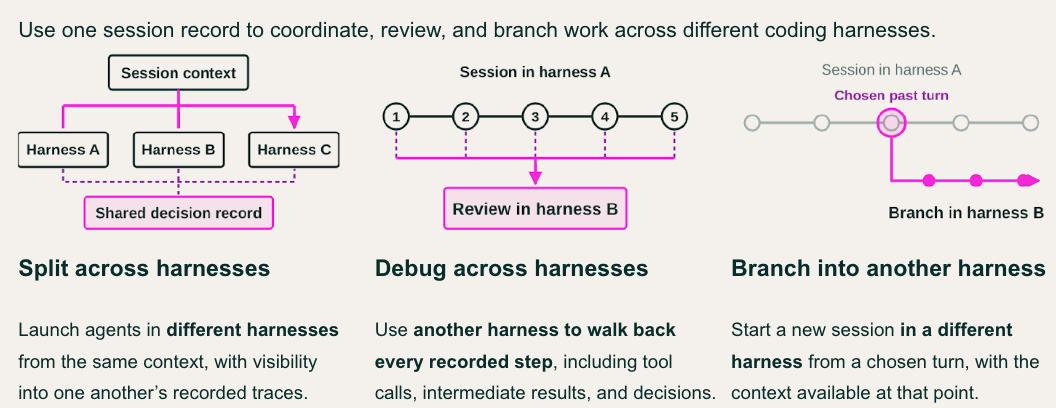
Three patterns that coding harness tracing makes possible: shared context across harnesses, debugging and review with full history, and branching turns for experiments.
Debugging and review sessions
We can also go a step further in debugging and reviewing. When performing code reviews, agents can assess the full session to determine the alignment of results. This is a better representation of the user's intent than simply checking if the code works and matches the description. I find that allowing the reviewer to use Logfire MCP results in better, more actionable feedback from a reviewer, and fewer subsequent revisions after the fact.
Having access to prior session context allows your agent to assess its own past mistakes when debugging the resulting issues today. In the common scenario where the thing your agent built fails, you have both the record of the failure and the full record of how it was implemented, as well as the original intention. This additional context can greatly speed up improvements and lead to long-term memories that will avoid the same mistakes the next time around.
Branching turns for experimentation
Most harnesses today give you the option to branch to a new session for a given turn. With coding harness tracing, you can branch to a new session from any harness and any recorded turn. This is perfect for experimental flows where you need an apples-to-apples comparison of different harnesses on the exact same task with the same context.
This is an especially useful pattern when building your own harness or software factory. You can gather scenarios and then compare established agents and their approach to the harness you are building, and evaluate them on the criteria that are important to you.
Turning repeated struggles into new skills
Repeated tasks can produce inconsistent results when agents lack the context to stay on course. This often manifests as long tangential exploration, unnecessary check-ins, and incomplete tasks. With coding harness tracing, records of poor performance become critical signals for skills that map out the process end to end.
Where people most often get lost is in translating relevant signals to useful skills. With a coding harness and the Logfire MCP server, you can break the process down into 4 repeatable stages.
First, you gather evidence from the traces for the agent to use in creating a new skill. To ensure the skill aligns with your expectations and remove ambiguity, you work with the agent to map out a repeatable process using evidence from historical successes and failures. With the evidence and the process established, you can have the agent draft a new skill for the task. The final step is validating the skill to make sure it actually fixes the problem without causing new issues. To do this, you can take the session context collected in the first step and create an experiment that compares the same harness with and without the skill loaded.
The full process is shown below:
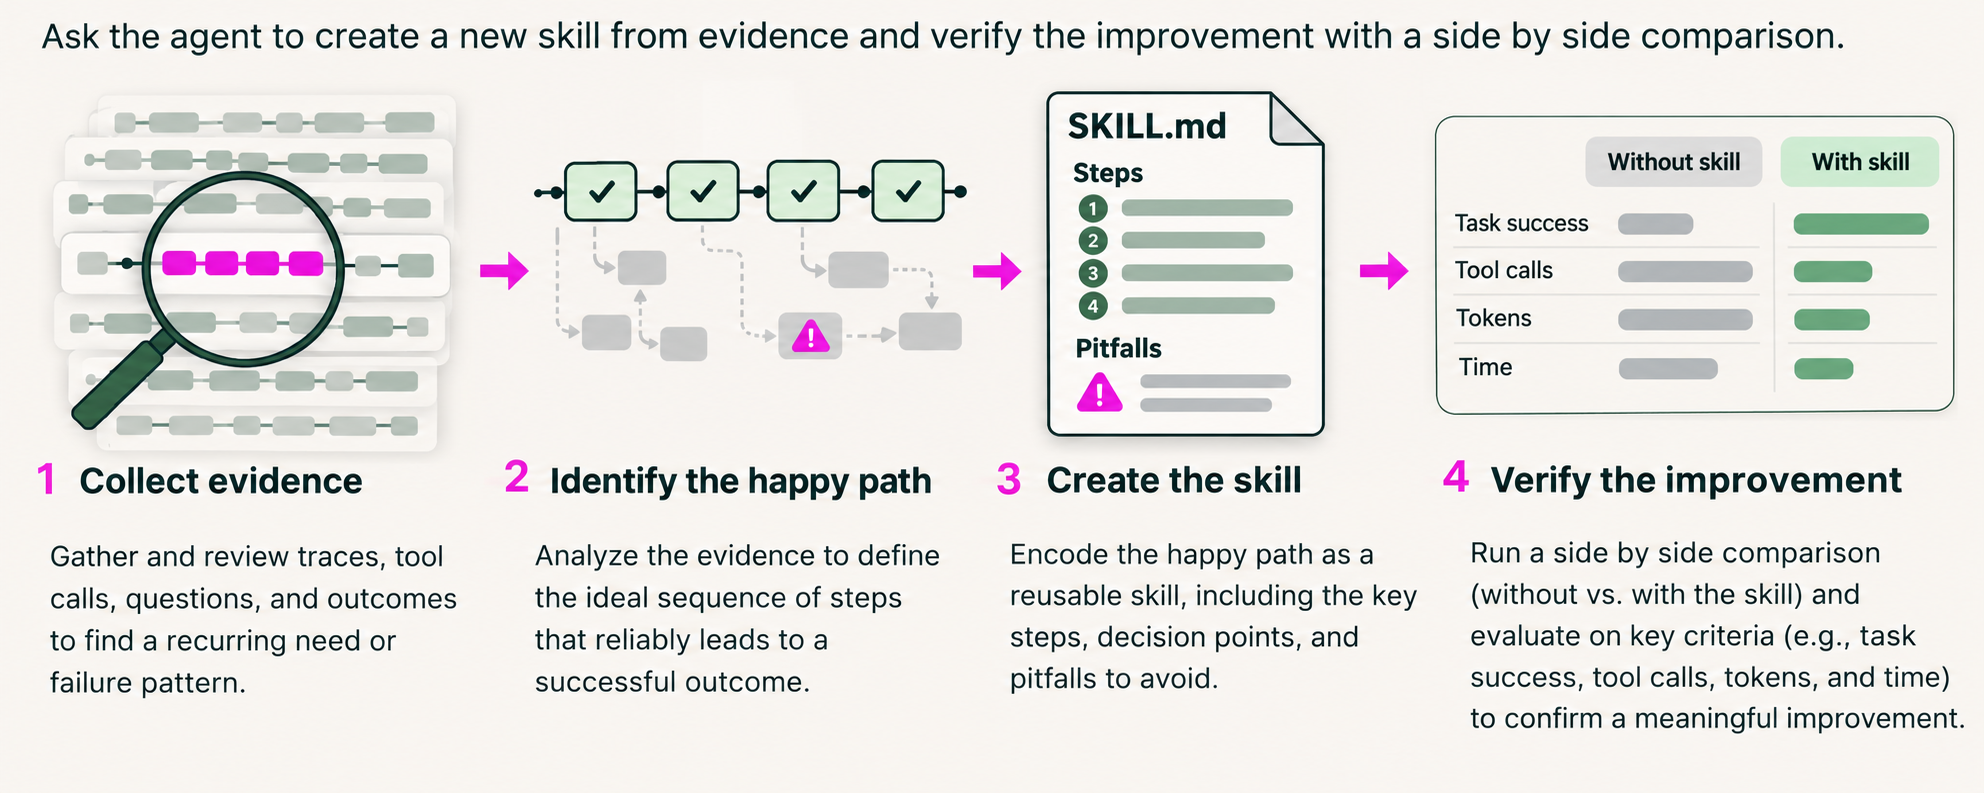
The four stages of building a skill from traces: collect evidence, identify the happy path, create the skill, and verify the improvement by comparing runs with and without it.
To demonstrate this process and show that it really works, I'm going to walk through a scenario that came up recently.
Collecting the evidence
If you encounter the same issue more than once in a process, that's usually a sign that the agent lacks the context or direction it needs. I often use the Logfire MCP server to create dashboard panels using queries over traces. In the creation of new dashboards, there were generally 1-2 invalid queries and a few panels that required revision and rework to get right.
To get a sense of the prevalence of this issue, I used the Logfire MCP to search the coding agent traces for invalid queries and rework. That resulted in the artifact shown below:
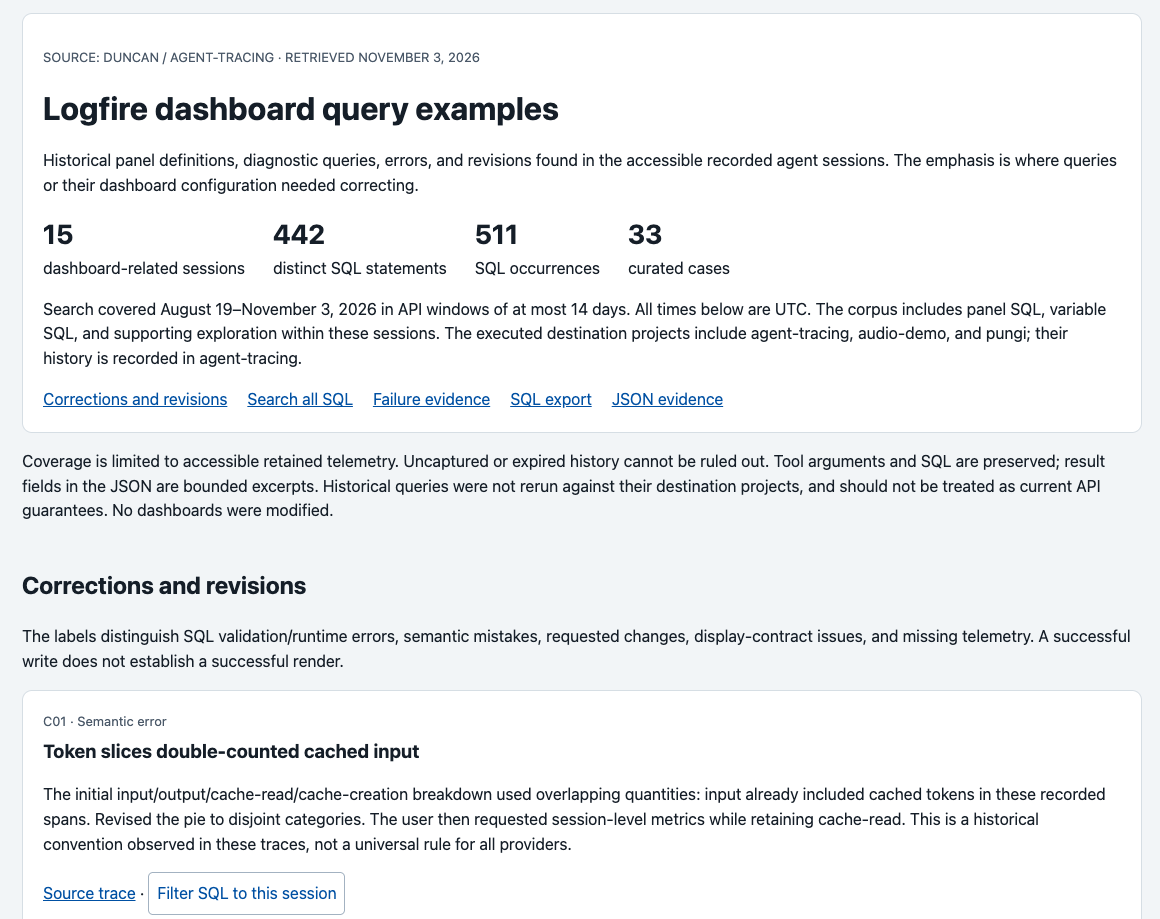
The evidence report the agent produced from the traces. Each case records a correction, such as a query that double-counted cached input tokens.
The agent also catalogued the errors and listed them out individually. This collection of evidence was the perfect starting point for developing a new logfire-dashboard-query skill.
Identifying the happy path and creating a skill
Creating skills without evidence or based solely on an expectation of failure usually results in unnecessary bloat. With evidence of the issue and resolutions, you can iterate with the agent on the expectations for the skill. In this case, I wanted the agent to validate queries, avoid common pitfalls, and review the dashboards it created for alignment.
The interactions also contained evidence of my personal preferences and best practices, so I wanted those encoded generally across every panel that would be created. There is some nuance in this step, but it's where you can also begin to shape the criteria you'll use to evaluate the skill.
For this skill validation the criteria were based on the validity of the query, the number of steps required to create the panels, and the handling of different types of variables.
Verifying the improvement
To actually validate the improvement, you need to carefully structure the experiment. The agent runs should all use the same harness configuration, on the same sessions and prompts. Only the presence or absence of the skill should account for differences. Luckily, you can use the traces already collected with the Logfire MCP server as the test set. This is an example of branching turns for experimentation, because you need to grab the prior context and invocation without anything hinting at the past turn's results.
For this experiment, I took 12 dashboard panel creation scenarios with a variety of errors mixed in, and ran them on the same codex harness with and without the skill loaded. The results are shown in the Logfire experiment view. Without the skill, 9/12 runs failed and several of the formatting mistakes showed up as well. With the skill, every scenario succeeded without mistakes.
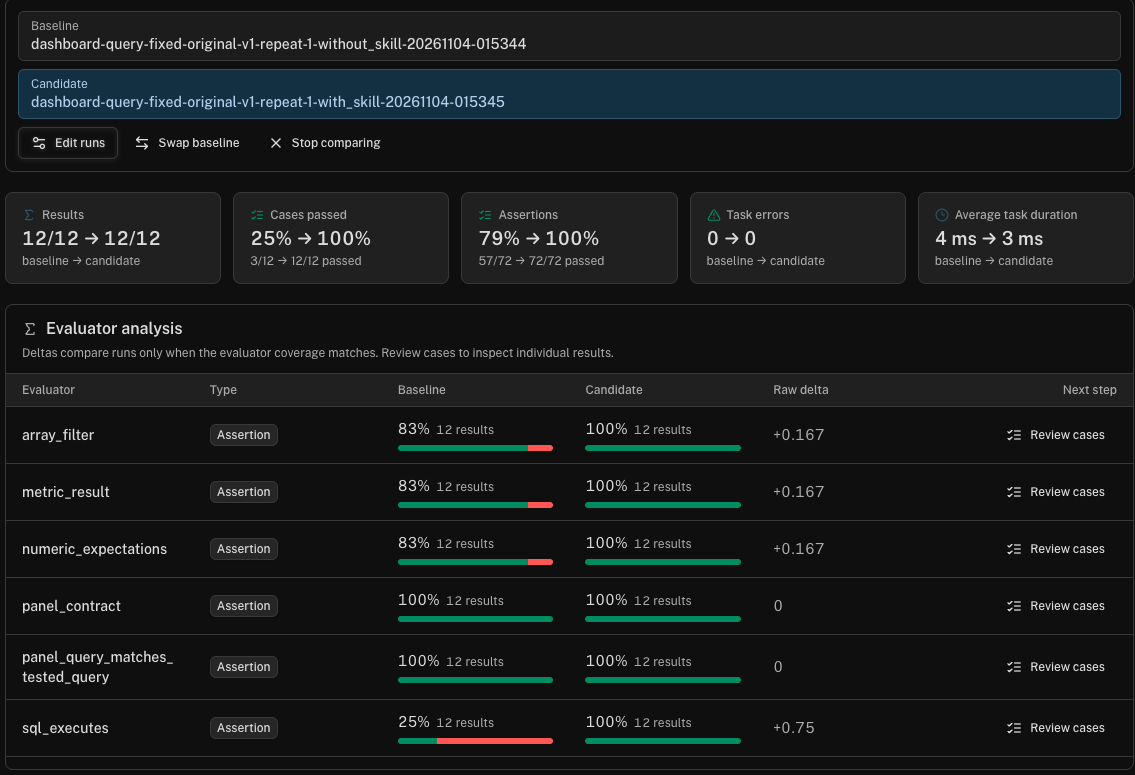
Logfire experiment view comparing the run without the skill (baseline) and with it (candidate). Cases passed went from 3/12 to 12/12 and assertions from 57/72 to 72/72. The largest gap was sql_executes, which went from 25% to 100%.
Evaluating and improving harnesses
The last pattern we'll show here combines several of the methods already introduced here towards the goal of actually improving your harness or optimizing your workflows. When you're using coding agents long enough you start to notice the subtle differences in behaviors when invoked with different models, harnesses, or instructions. Some models waste more tokens with over-engineering, others halt prematurely in long tasks, and then there is always the possibility of getting stuck in exploration loops.
There are a couple options when looking at ways to fix issues with agent behavior. You can try adjusting any of the levers mentioned above. You can try building your own harness. You can ignore it and hope it gets better. The problem with each approach on its own is that you don't have the data to verify the change had the desired effect, and that it didn't introduce new problems that will need to be fixed.
That's where experimentation flows for agent improvement come into play. The approach follows steps similar to the development of new skills, as shown in the diagram below:
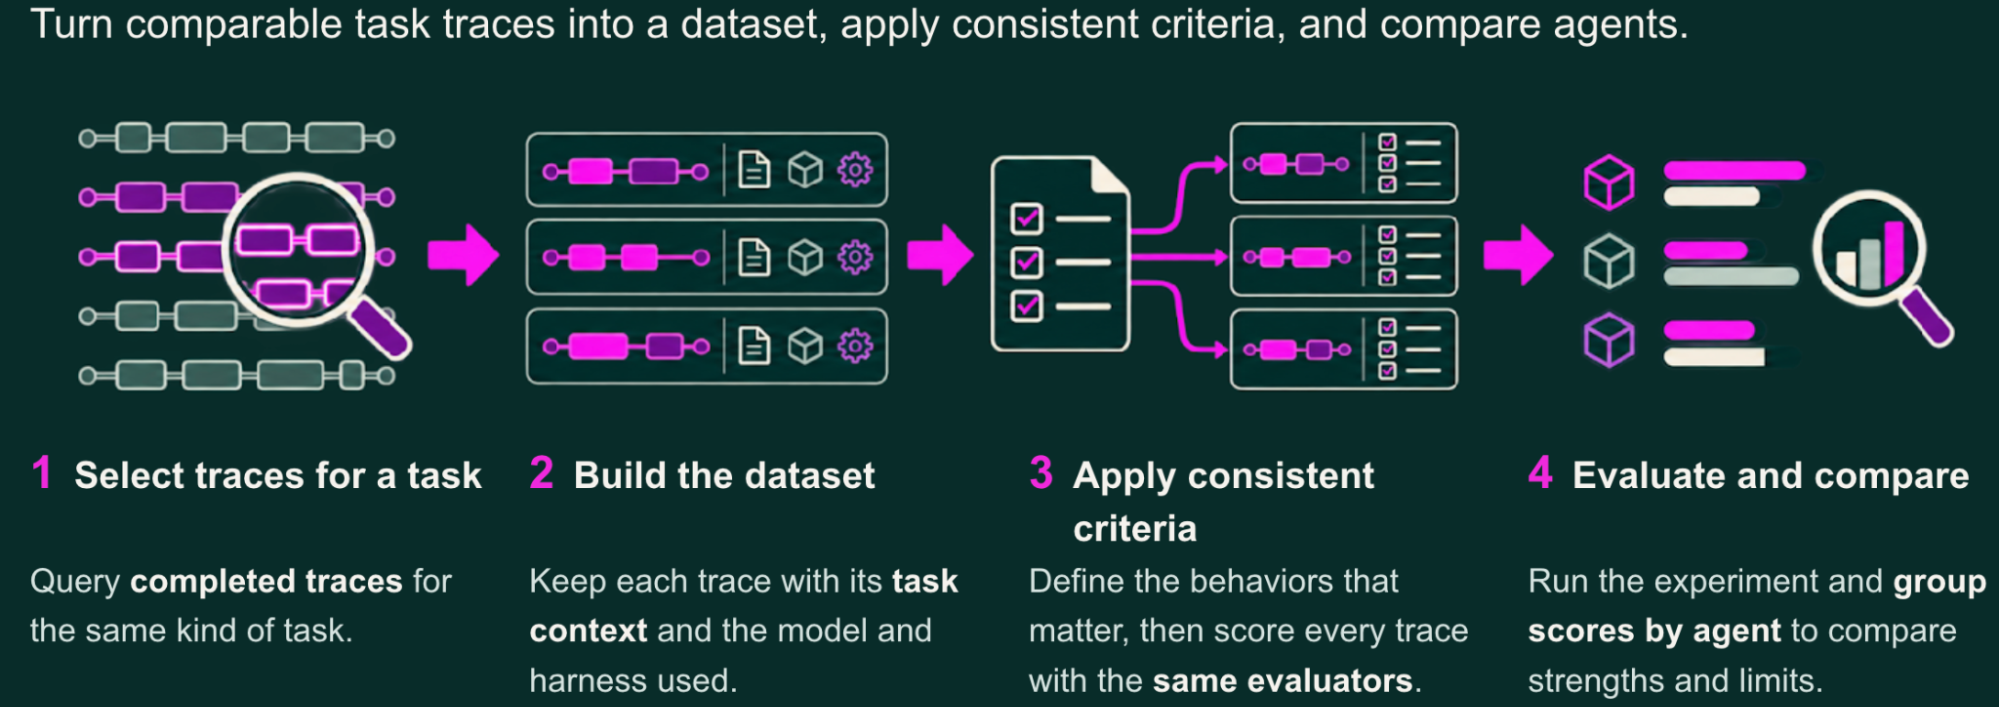
The evaluation workflow: select comparable traces for a task, build a dataset that keeps each trace's context along with the model and harness used, apply consistent criteria, then compare agents on group scores.
Finding the traces and building the datasets
The first step is gathering the example prompts for the scenario you're trying to improve. In this case, you need examples that reflect both good and bad behavior, both in order to validate your criteria as well as to prevent regressions. You don't want to change the behavior such that something else breaks.
In this case, I went back to the visualization earlier where I noticed that agent fixes were actually the most expensive operation in my software factory.
Cost by phase of the software factory pipeline, repeated from above. Review-fix is the most expensive phase at $43.30, which is why the experiments target the reviewer and implementation agents.
To reduce the need to fix things I develop a two step sequence of experiments:
- Optimize the reviewer agent so that it doesn't fail as many reviews due to small stylistic choices, while still adhering to the instructions and conventions provided in the prompt.
- Optimize the implementation agent so that the code doesn't fail the reviews and require fixing cycles.
For this example, we'll just focus on the first stage, improving the focus and performance of reviewer agents. To start out, I searched back through the traces across different harnesses to find examples of review runs. To keep the experiments manageable, I collected 5 examples from small PR reviews.
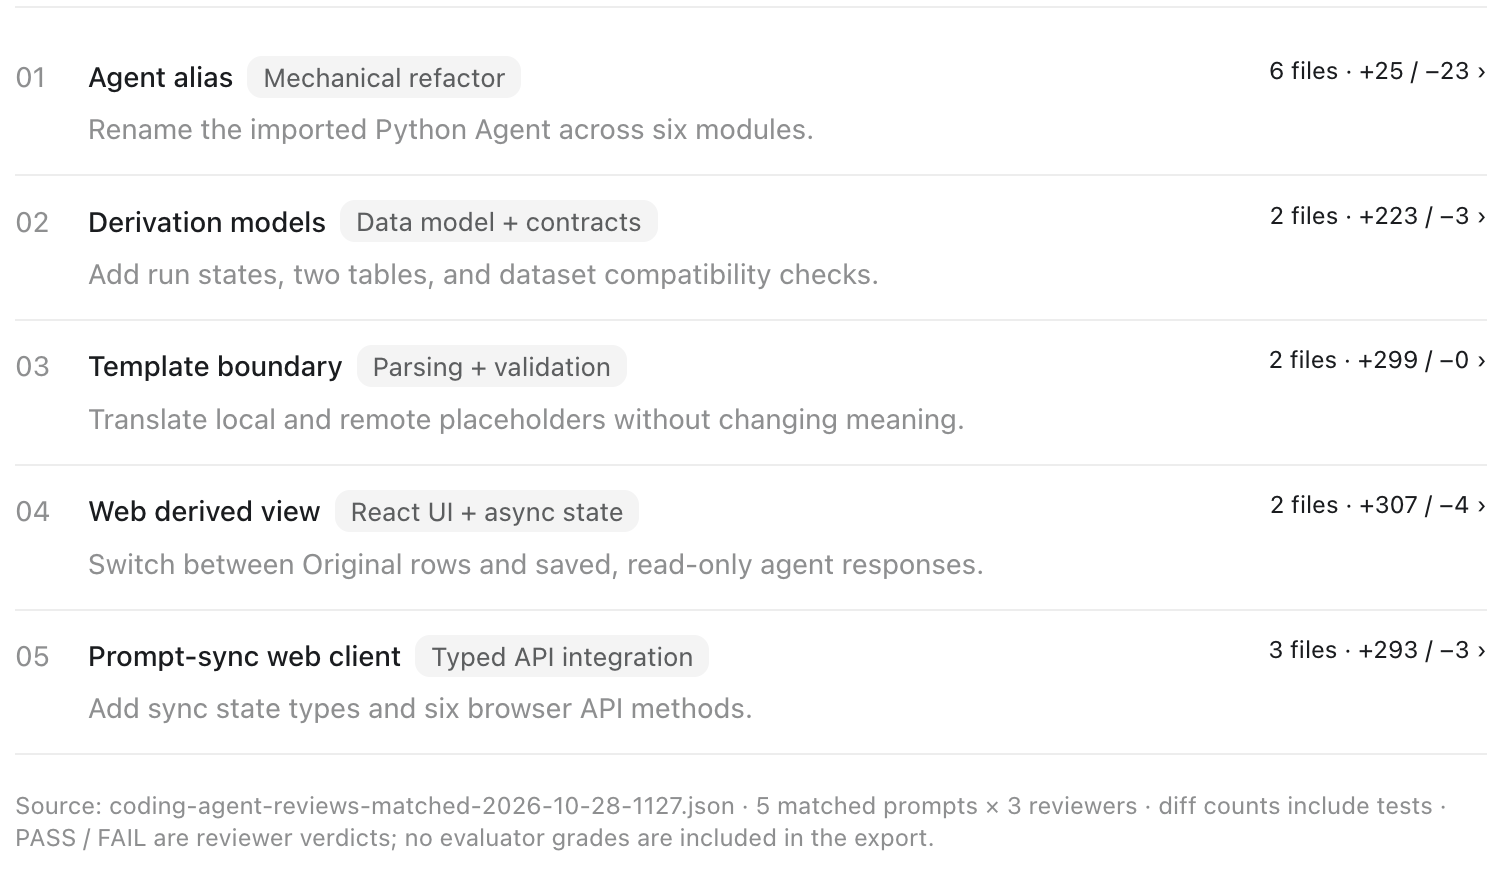
The five matched code review cases, each from a real change, with the size of each diff: an agent alias refactor across six modules, derivation models, a template boundary, a web derived view and a prompt-sync web client.
Since this data needs to be used in an experiment, the context needed to be added to a Logfire dataset. Datasets are for this exact scenario: fixed example cases to use when re-running evaluations with different agent or harness configurations. Since the outcome of the original reviews was irrelevant, I collected only the context that was fed into the original review step for re-use in experimentation and built the dataset.
I chose to test these 5 reviews on 3 different coding harnesses to see which one I should plug in to the review stage in my software factory. I compared Claude Code with haiku-5.5, Codex with gpt-6-luna, and Cursor with composer-2.5 to see which one gave the most effective PR reviews.
Evaluation criteria
Probably the most critical component of the experimentation and improvement flow is the evaluation criteria. This is where you encode alignment into the system you're developing. It's important to remember that most criteria are bounding undesirable outcomes rather than pushing towards a minima or maxima. In the case of reviews, I developed two agent evaluations that would run asynchronously using the inputs and outputs of the review agent.
The first evaluation tested the amount of nit-picking the reviewer was doing. This evaluator penalized overly sensitive review failures that cited formatting or stylistic choices. To balance the risk of overly lenient reviewers, the second evaluator measured how well the agent adhered to the conventions specified in the instructions. For my software factory, every agent receives a set of conventions to follow that basically lays out which frameworks to use and how code should be structured. The second evaluator penalized misalignment with the stated coding expectations.
Experiments and results
Once the dataset and evaluators are created, the only thing left to do is run the experiment and interpret the results. In this context, an experiment means invoking the agent with the prompt from the dataset, running evaluations on the results, and aggregating across the cases to see the overall performance on each criterion.
For the reviewer experiments, each evaluator rated the response on 1-4 scale, where more significant issues with the review receive lower scores. Below is a table with the actual scoring for each harness and model. The PR verdicts are not included in the analysis of the agent's performance, but it's worth noting that some harnesses proved more strict or lenient and that is reflected in the scoring.
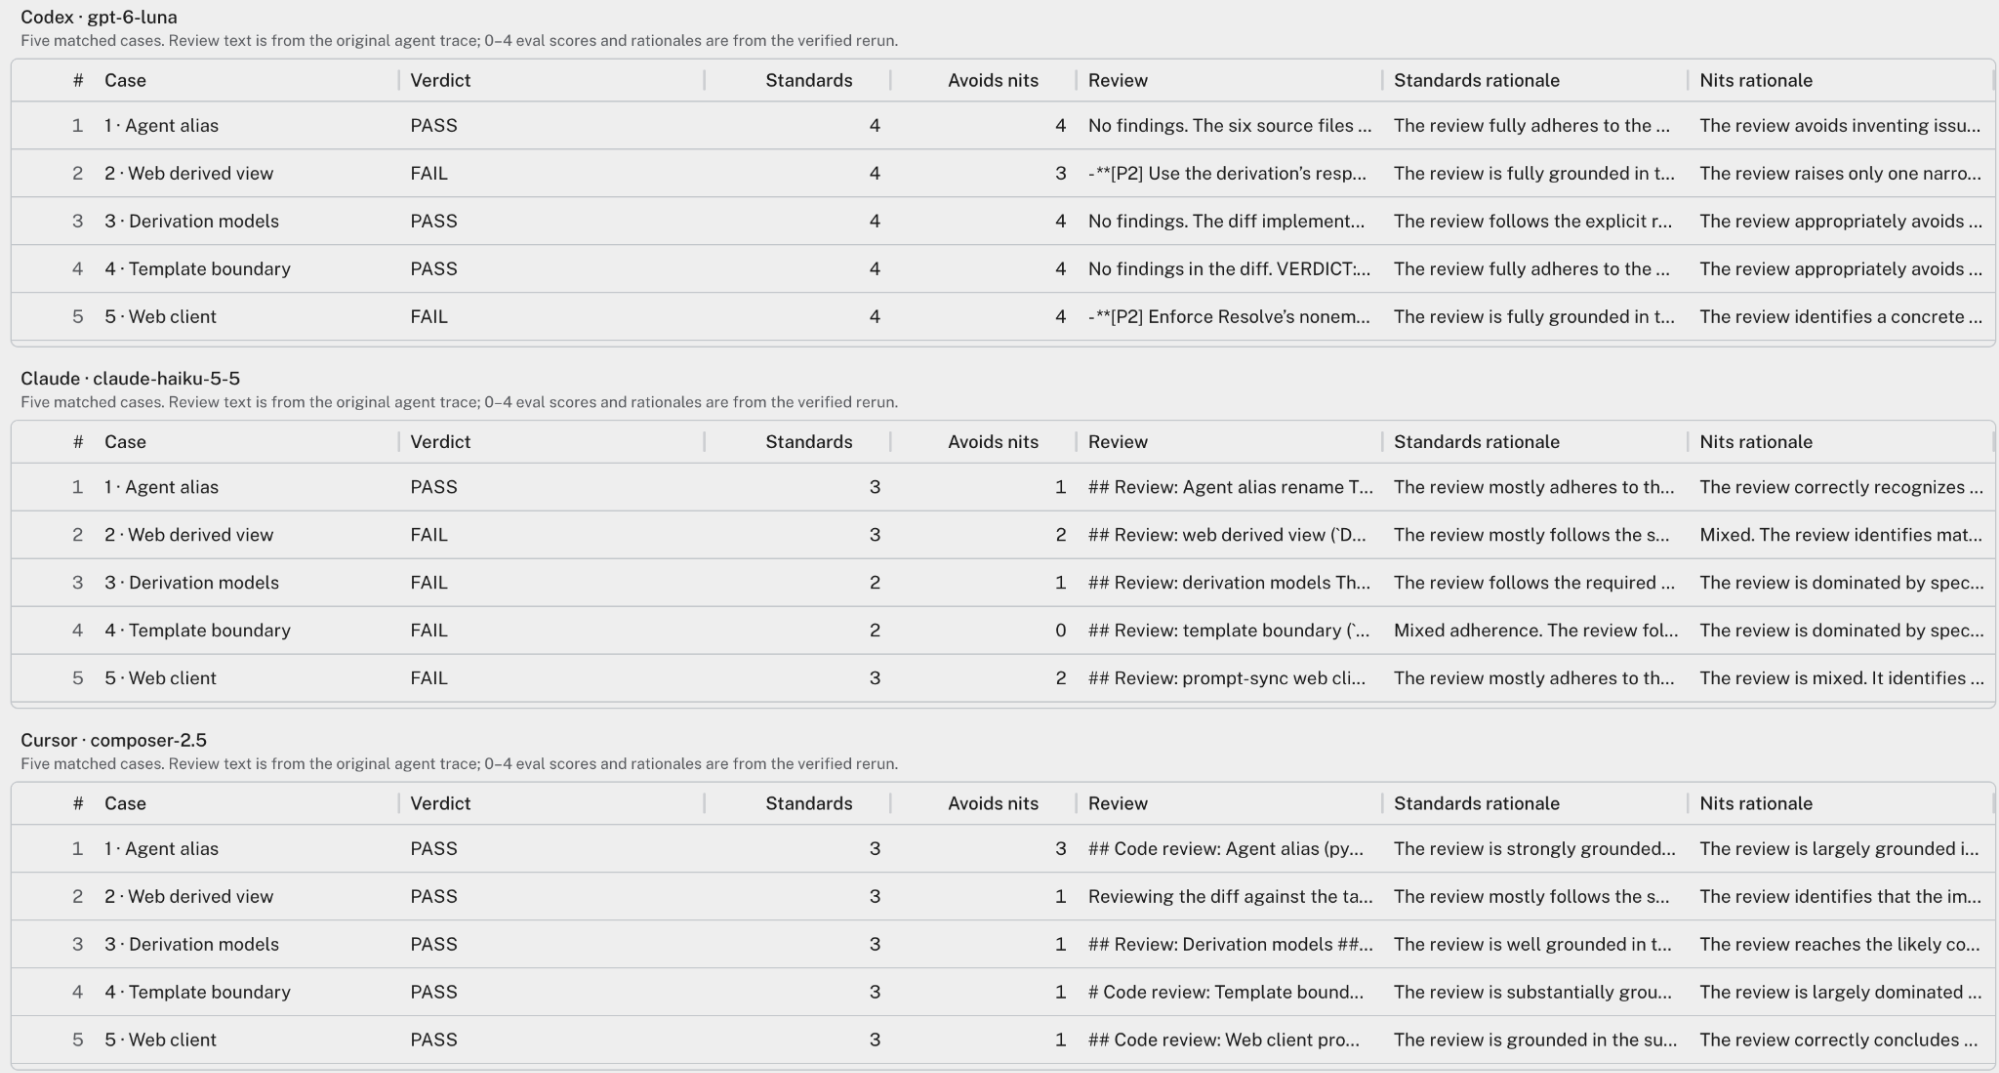
5 reviews each for Codex, Claude-Code, and Cursor. The tables show the individual scores for each review on the 2 evaluation criteria used to assess performance.
The aggregate results painted a clear picture. Codex with gpt-6-luna significantly outperformed Cursor composer-2.5 and Claude haiku-5.5 on both standards adherence and avoiding nit-picking. In fact, on both criteria the order was the same, with Claude performing worst. The quality average shown here is the average on the 2 evaluation criteria, while the overall average simply incorporates a third metric meant to ensure the review ended in a verdict (which all runs did).
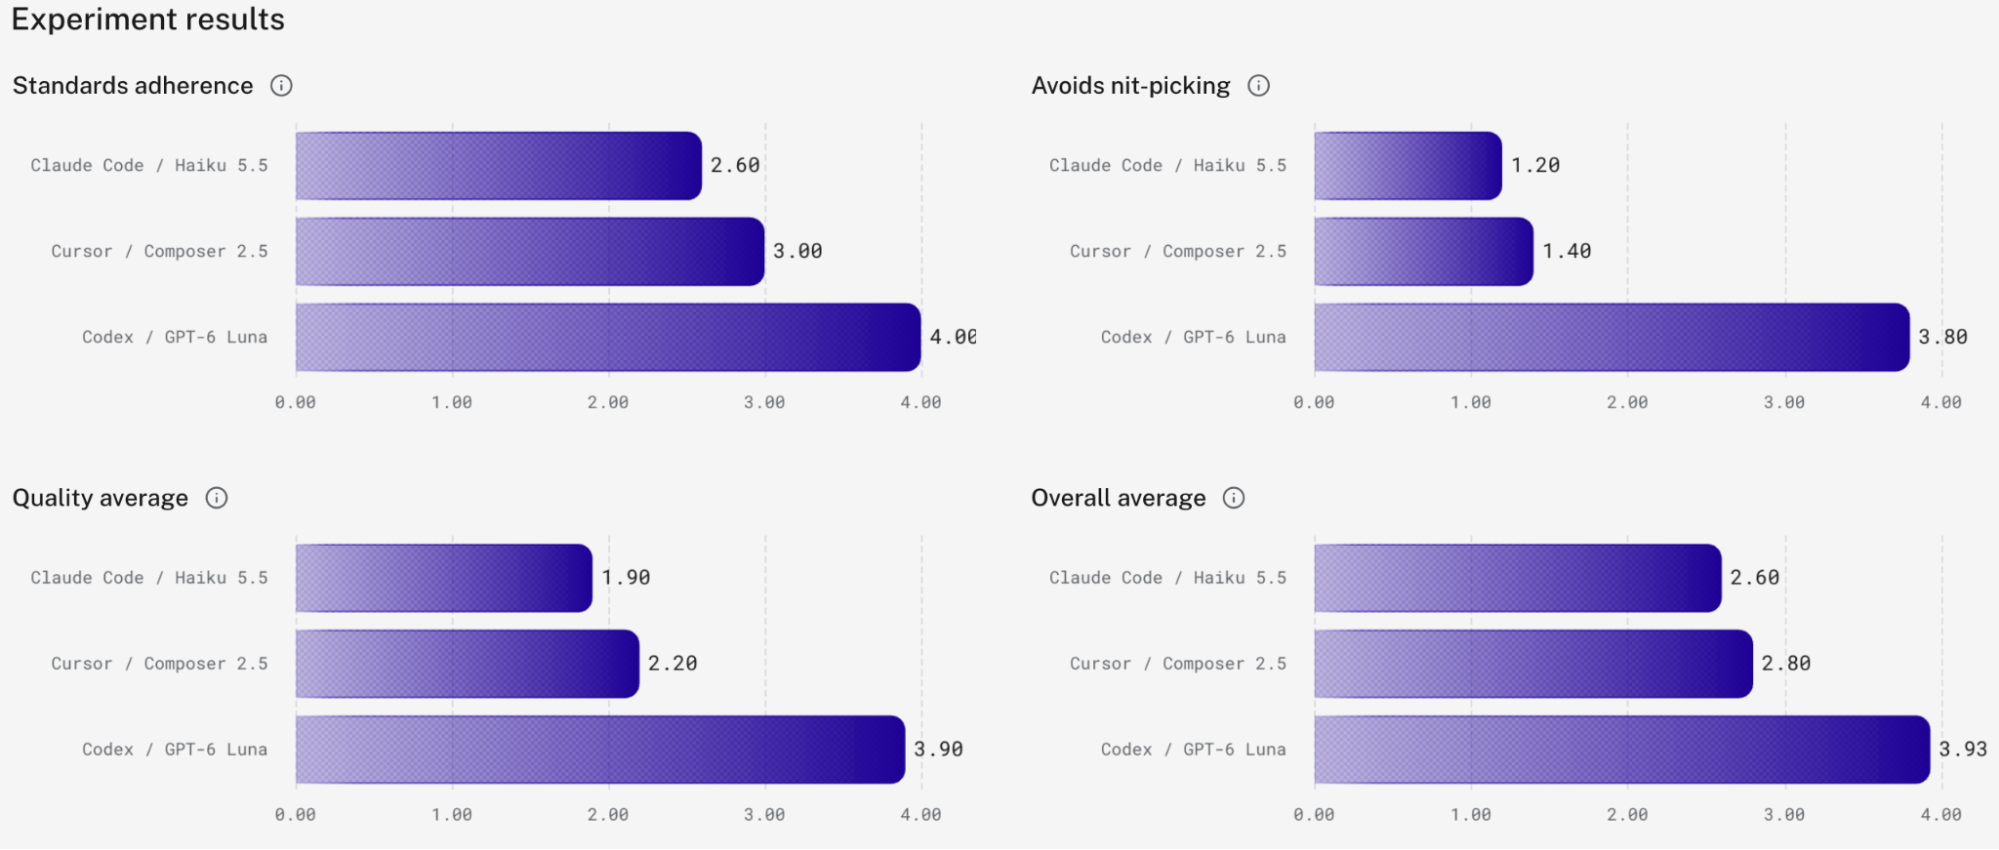
Reviewer scores out of 4 for the Claude Code, Cursor and Codex setups on the five cases. Codex scores highest on every panel (overall 3.93), Cursor is next (2.80) and Claude Code is lowest (2.60).
Where to go from here
The patterns shown here are useful today in most coding agent configurations, but they are by no means an exhaustive representation of what is possible with an observability framework like Logfire. There are new features coming out every day, but they all require data and experimentation to drive improvements in performance and efficiency like the ones outlined here. These patterns show how tracing and experimentation can help teams improve coding agent performance and efficiency.