AI Observability Platform for LLMs, Apps & AI Agents
Monitor your entire AI application stack, not just the LLM calls. See the model call, the agent's next step, the API request and the database query behind it in one trace. SDKs for Python, JavaScript/TypeScript and Rust, and OpenTelemetry for everything else.

Companies who trust Pydantic Logfire
Boosted.ai, DeepScribe, Airbyte, Evergreen.ai, Fleet AI, Seekr, Polar.sh, Stuut, Alpaca, Motorway, WorkWhile, Sophos, Aignostics, Amboss, Motorola, Epistemix, Nous Research, Pictet, SimpleClub, Tiger Data, Vox Media, ZenHub, Weaviate


Understanding
What is an AI observability platform?
An AI observability platform is a tool that provides advanced features beyond traditional monitoring. While standard monitoring tells you that a system failed, an observability tool allows you to identify the underlying causes. In the era of Large Language Models (LLMs) and autonomous agents, this distinction is critical.
An effective AI observability platform allows engineering teams to trace the lifecycle of a prompt, analyze token usage and latency per step, and benchmark model responses against groundedness and toxicity metrics.
The Full Picture
Break down silos: one tool for both AI and general observability
Most engineering teams are forced to use one observability tool for their backend application and a completely separate one for their LLMs. However, problems in production AI applications rarely come from the LLM alone. They hide in the seams: slow database queries that delay context retrieval, API timeouts during agent tool calls, inefficient vector searches, or memory leaks in background tasks. You need visibility across your entire application stack, not just the LLM calls.
What Logfire shows you
- ✓ Complete application traces from request to response
- ✓ Database queries, API calls, and business logic
- ✓ Dashboards and application metrics
- ✓ One platform with first-class AI & general observability for your entire application
What others show you
- ✗ LLM request/response only
- ✗ Missing context on performance bottlenecks
- ✗ Infrastructure and background jobs out of scope
- ✗ Separate tools for app monitoring
Evals
Evals that live inside the trace, not in a tool beside it
Airbnb published the clearest public account of evaluating generative AI at scale: read real outputs first, then build evaluators for the failures you actually found, in three layers. Logfire runs all three, and the score lands on the span it scored, beside the database query, the tool call, and the retry that explain it.
01
Programmatic checks
Failures code can identify exactly: malformed JSON, a missing citation, a tool called with the wrong arguments, a response over the length budget. Cheap, deterministic, and they run on every case.
Writing evals02
LLM judges, one job each
For the qualities code cannot check: is the tone right, does the answer follow from the retrieved context, is it actually responsive to the question. A judge with one narrow job is far more reliable than one asked to grade everything.
Datasets and experiments03
Human review as ground truth
People settle the disputed cases and calibrate the judges, so you know how far to trust an automated score before you gate a release on it.
Human reviewThen close the loop
Run the same evaluators offline against a dataset to compare a prompt or model change, and live against production traffic to catch what your dataset never contained. Production failures become the next dataset case, and the loop starts again.
Because a score is just an attribute on a span, you can query your evals and the rest of your telemetry together with the same PostgreSQL-compatible SQL, and evals bill as ordinary records rather than carrying a separate per-score fee.
The Pydantic Stack
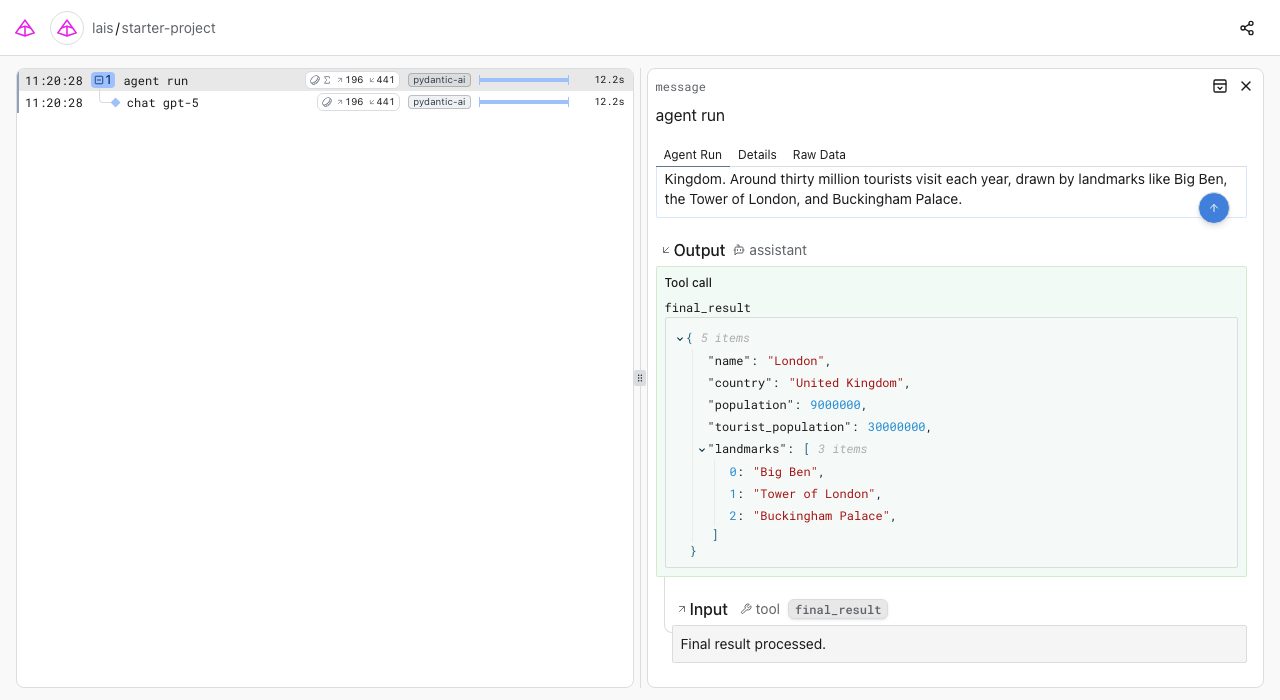
From prompt to validated output in one trace
See how Pydantic AI, AI Gateway, and Logfire work together. Define your schema with Pydantic models, extract structured data with an AI agent, route through Gateway for model flexibility, and observe the entire flow in Logfire.
import logfire
from pydantic import BaseModel
from pydantic_ai import Agent

logfire.configure()
logfire.instrument_pydantic_ai()


class City(BaseModel):
    name: str
    country: str
    population: int
    tourist_population: int
    landmarks: list[str]


agent = Agent(
    'openai:gpt-5',
    output_type=City,
    instructions='Extract information about the city',
)
result = agent.run_sync(
    'London is home to over nine million people, making it the largest '
    'city in the United Kingdom. Around thirty million tourists visit '
    'each year, drawn by landmarks like Big Ben, the Tower of London, '
    'and Buckingham Palace.'
)

logfire.info(f'Here is the output: {result.output=}')
Why Logfire for AI Observability?
OpenTelemetry-native
Any framework with OTel instrumentation works automatically. No special Logfire integration needed. Vercel AI SDK, LangChain, FastAPI—enable OTel, point to Logfire, done.
Complete application traces
See your entire application: LLM calls, agent reasoning, database queries, API requests, vector searches, business logic, JS/TS frontend.
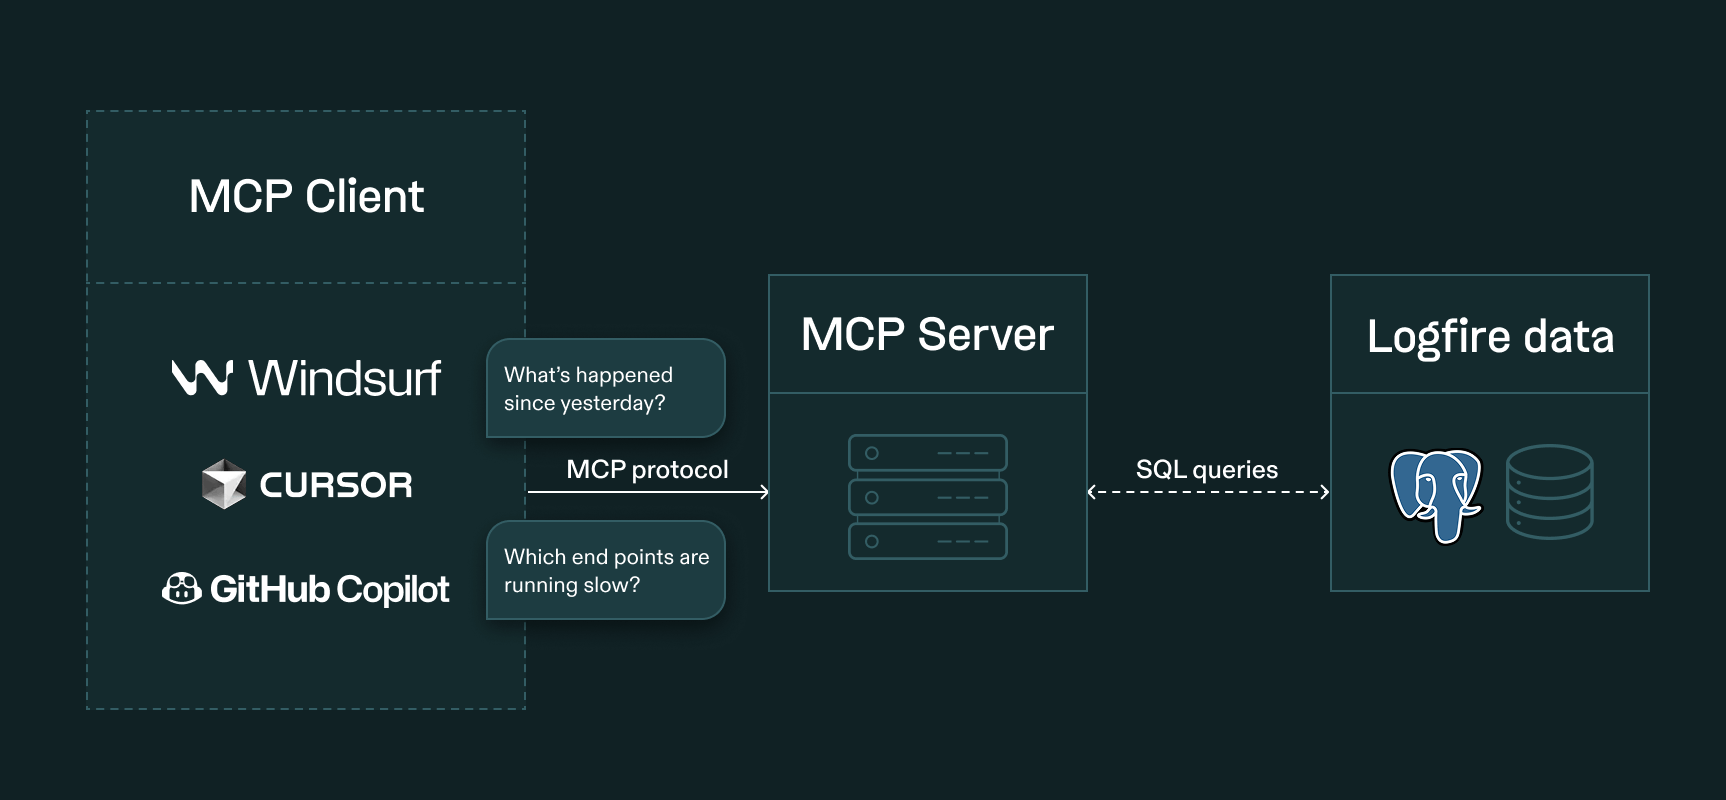
Logfire acts as an MCP server
Use your favorite coding assistant (like Claude Code, OpenCode, and Cursor) to talk directly to your Logfire data inside your code editor.
Integrated evaluation framework
Use Pydantic Evals to continuously evaluate LLM outputs in production. Curate datasets from production traces and catch regressions before users do.
Real-time cost tracking
Track LLM API costs in real-time. Identify expensive prompts, optimize model selection, and set budget alerts. See exactly where your AI spending goes.
Pydantic AI and AI Gateway integration
Natively integrates with Pydantic AI and Pydantic AI Gateway for model routing & budget control across all major LLM providers.
From local dev to production
See all app traces in real-time as you code. Catch bugs in development, carry the same observability through to production. No tool switching, no friction.
First-party SDKs for Python, JS/TS and Rust
Full SDKs for Python (AI frameworks), JavaScript/TypeScript (Node.js, Next.js, browsers, Cloudflare Workers, Deno), and Rust. Plus any OTel language.
Query your data with SQL
Drill down into your traces with SQL and use Natural Language Processing (NLP) to auto-generate your SQL queries.
Need self-hosting, SSO, or custom data retention? Talk to our team
Open Standards
Monitor your stack with OpenTelemetry
Logfire is built on OpenTelemetry, giving you a unified view of logs, traces, and metrics with no vendor lock-in. Our SDKs for Python, Rust, and TypeScript make instrumentation simple, and power features like live spans that render before they complete.
Logs
Structured and automatically redacted, with every log (span) linked to its trace. Search instantly or query with SQL.
Traces
One end-to-end timeline that combines APIs, databases, third-party calls, LLMs, and AI agents in one view.
Metrics
Track what matters to you: latency, errors, performance, cost, or any trend across your system. Set custom SLOs and alerts to keep your application reliable.
Multi-Language Support
Built for polyglot architectures
Real applications are rarely single-language. Your Python AI backend talks to a TypeScript frontend, Go microservices, and Java legacy systems. Logfire traces them all in unified, correlated views.
Python AI and a TypeScript frontend
See your agents and Next.js frontend in unified traces. Track requests from browser to AI model and back.
Microservices in several languages
Python, Go, Java, Node.js: one dashboard, complete visibility. Trace requests across service boundaries automatically.
Edge and backend
Cloudflare Workers or Vercel Edge to Python backend, traced end-to-end. See latency at every hop.
Build with Vercel and trace with Logfire
Logfire works seamlessly with the Vercel ecosystem. Use @vercel/otel automatic server-side tracing, or our browser SDK for client-side visibility. The Vercel AI SDK has built-in OTel support, so you enable it rather than add it.
Integrations
Logfire works with your entire stack
Observability should not require a rewrite of your codebase. Built on open standards (OTel) with SDKs for Python, Javascript/Typescript, and Rust, Logfire supports auto-instrumentation for AI frameworks, web frameworks, databases, background workers, browsers, and more.
Python
AI / LLM
Pydantic AI OpenAI Anthropic Google GenAI LangChain LlamaIndex LiteLLM Mirascope MCP
Web Frameworks
Databases
Other
JavaScript / TypeScript
Vercel AI SDK ✨ Browser Next.js Express Node.js Deno Cloudflare Workers
✨ Vercel AI SDK has built-in OTel support, so no special integration is needed
Rust
tracing opentelemetry log crate
Built on tracing + OpenTelemetry ecosystem
Any Language via OpenTelemetry
Logfire is built on OpenTelemetry. Any framework with OTel instrumentation works automatically, with no special integration needed. Our listed integrations are convenient wrappers, not requirements.
Go Java .NET Ruby PHP Erlang/Elixir Swift C++
Insights
Query your data with full SQL
Query your data with full Postgres flavored SQL — all the control and (for many) nothing new to learn. Even if you don't like writing SQL, LLMs do, so SQL plus an MCP server lets your IDE use Pydantic Logfire as a window into your app's execution. Search for obstacles and opportunities, as you (or the AI) writes code.
With Proprietary DSLs
- • Limited to anticipated queries
- • AI assistants struggle with unfamiliar syntax
- • Constrained analysis capabilities
- • Vendor lock-in
With Logfire SQL
- • Ask any question, get any answer
- • AI assistants write excellent SQL
- • Full analytical power—JOINs, aggregations, CTEs
- • Familiar syntax—no new query language to learn
Enterprise Ready
Enterprise-level AI observability
AI applications often process sensitive user data. As a result, enterprise-level AI observability platforms need to meet strict security, compliance, and data privacy standards. Pydantic Logfire is architected to meet the rigorous governance standards of enterprise engineering teams.
Data sovereignty & self-hosting
Industries with strict data residency requirements (Finance, Healthcare, Legal) can make use of our fully self-hosted enterprise plan.
SOC2 Type II certified
Logfire is SOC2 Type II certified. We did not receive any exceptions in our report. A copy is available upon request.
HIPAA compliant
Logfire is HIPAA compliant. We are able to offer Business Associate Agreements (BAAs) to customers on our enterprise plans.
GDPR-ready & EU data region
DPAs are available, with documented subprocessors. For customers who need data kept in the EU, we offer an EU Data Region.
Logfire is already making developers' lives easier
Compare Logfire
See how Logfire compares to other observability and LLM monitoring tools.
Ready to see your complete AI application?
Start monitoring your LLMs, agents, and entire application stack in minutes. 10 million free spans, logs, and metrics per month. No credit card required.
Frequently asked questions
What is AI observability?
AI observability describes a system that provides end-to-end visibility across an application and all its AI layers: LLMs, RAG, and agents. An AI observability platform correlates logs, traces, metrics, prompts, parameters, cost, and quality signals in one place and on one timeline.
What is the difference between APM and AI Observability?
Traditional Application Performance Monitoring (APM) focuses on system health metrics like CPU usage and request latency. AI Observability extends this to include LLM-specific metrics such as token usage, cost per request, prompt inputs/outputs, and hallucination detection.
How does Logfire help with RAG (Retrieval-Augmented Generation)?
Logfire traces the entire RAG pipeline. You can see the user query, the vector database retrieval latency, the retrieved context chunks, and the final LLM generation on one timeline, so a slow retrieval or an irrelevant chunk is visible next to the generation it fed.
Does Logfire work with LangChain and LlamaIndex?
Yes. Logfire provides auto-instrumentation for major AI frameworks including LangChain and LlamaIndex, allowing you to visualize complex agentic chains and retrieval flows automatically.
Does Logfire support AI Agents?
Yes. Tool calls, retrieval, and reasoning steps each land as a span with duration, errors, and cost, so you can spot loops, set step-level SLOs, and see exactly which step to optimize.
Is Logfire OpenTelemetry-native?
Yes. Logfire ingests OpenTelemetry signals and preserves OTLP portability, so you can reuse existing instrumentation, forward subsets to your SIEM/warehouse, and avoid vendor lock-in.
Do I need special Logfire integrations for my framework?
No. Logfire works with any OpenTelemetry-compliant instrumentation automatically. If your framework has OTel support (many do, including Vercel AI SDK, LangChain, FastAPI, Express, and hundreds more), you can simply enable it and configure the OTel exporter to send to Logfire. Our listed integrations are convenient wrappers that simplify setup, but they're optional—standard OTel always works.
How does Logfire handle security, privacy, and PII?
Logfire supports edge redaction through SDKs and collectors, role-based access with SSO, retention controls, and audit logs. For compliance posture, SOC 2, HIPAA, GDPR, and document request details, see the security page.
Can Logfire help control and reduce the cost of running AI and LLMs?
Yes. Track metrics such as token usage, cost per session/feature/route, and model/provider mix. Define custom SQL-backed alerts and budget caps to ensure costs stay within pre-defined boundaries.
Is Logfire only for Python applications?
No. Logfire is built on OpenTelemetry and works with any language. We provide first-party SDKs for Python (with deep integrations for AI frameworks), JavaScript/TypeScript (supporting Node.js, Next.js, browsers, Cloudflare Workers, and Deno), and Rust. For Go, Java, .NET, Ruby, and any other language with OpenTelemetry support, use standard OTel libraries - they work automatically with Logfire. Many teams use Logfire for polyglot architectures: Python AI backend + TypeScript frontend, microservices in multiple languages, etc. One dashboard, unified traces.
What exactly is Logfire and how is it different from other observability tools?
Logfire is a full-stack AI observability platform, not just a logging tool or LLM-specific monitor. Unlike traditional APMs that focus on infrastructure metrics, and unlike LLM-only tools that only show prompt inputs and outputs, Logfire gives you end-to-end visibility across your entire application — from HTTP requests and database queries to LLM calls, agent workflows, and RAG pipelines — all in a single, correlated timeline.
How does Logfire compare to LangSmith / Langfuse?
LangSmith and Langfuse focus primarily on LLM-layer tracing: prompt management, evaluation, and model behavior analysis. Logfire takes a broader approach: it's built on OpenTelemetry and provides full-stack observability across your entire application, including AI components. If your question is "why did the agent choose that tool?" a prompt-focused tool may help. If it's "why is this request slow, where's the bottleneck, and what's it costing me?", that is what Logfire is built for.
Does Logfire only work with Pydantic AI, or can I use it with other frameworks?
Logfire works with any framework, not just Pydantic AI. It's built on OpenTelemetry, so any application with OTel instrumentation can send data to Logfire — including LangChain, LlamaIndex, Vercel AI SDK, FastAPI, Django, Express, and hundreds more. Likewise, Pydantic AI uses OpenTelemetry for its observability, so it can send data to any OTel-compatible backend, not just Logfire. There's no closed ecosystem.
How do I get started / how much code does it take?
Getting started with Logfire takes less than 5 minutes. Install the SDK (pip install logfire for Python, or npm install @pydantic/logfire-node for JavaScript/TypeScript), call logfire.configure(), and you're sending data. For AI frameworks like Pydantic AI, add one line — logfire.instrument_pydantic_ai() — to get full agent tracing automatically.
What does it cost? Is it really free?
Logfire's free Personal plan includes 10 million logs/spans/metrics per month with no credit card required. Paid plans start at $49/month (Team) and $249/month (Growth), both with additional records at $2/M above their included allowance; Enterprise is custom-priced with volume discounts. Every paid plan includes a price cap option so there are no surprise bills. See the pricing page for full details.
Can I self-host Logfire?
Logfire's SDKs are open source, but the server application and UI are closed source. For teams with data residency requirements, Logfire offers both EU and US hosting regions, and the Enterprise plan includes self-hosted deployment with dedicated support: it deploys into your Kubernetes cluster with our open-source Helm chart. Contact the team for details.
Logfire has SDKs for Python, TypeScript/JavaScript, and Rust. The Python SDK is open source under the MIT license and wraps the OpenTelemetry Python package. By default, it will send data to the Logfire platform but you could send data to any OpenTelemetry Protocol (OTLP) compliant endpoint.